Stuff we talk about at Lumics
Industry Events
2026
Nov 9
WebSummit
Lisbon
Lisbon
Nov 12
SpiceWorld
Austin
Austin
Nov 16
LIVE! 360 TechCon
Orlando
Orlando
Nov 17
Kaseya Connect APAC
Sydney, Australia
Sydney, Australia
Nov 17
Managed Services Summit
Manchester UK
Manchester UK
Nov 17
Microsoft Ignite
San Francisco
San Francisco
Movie Posters
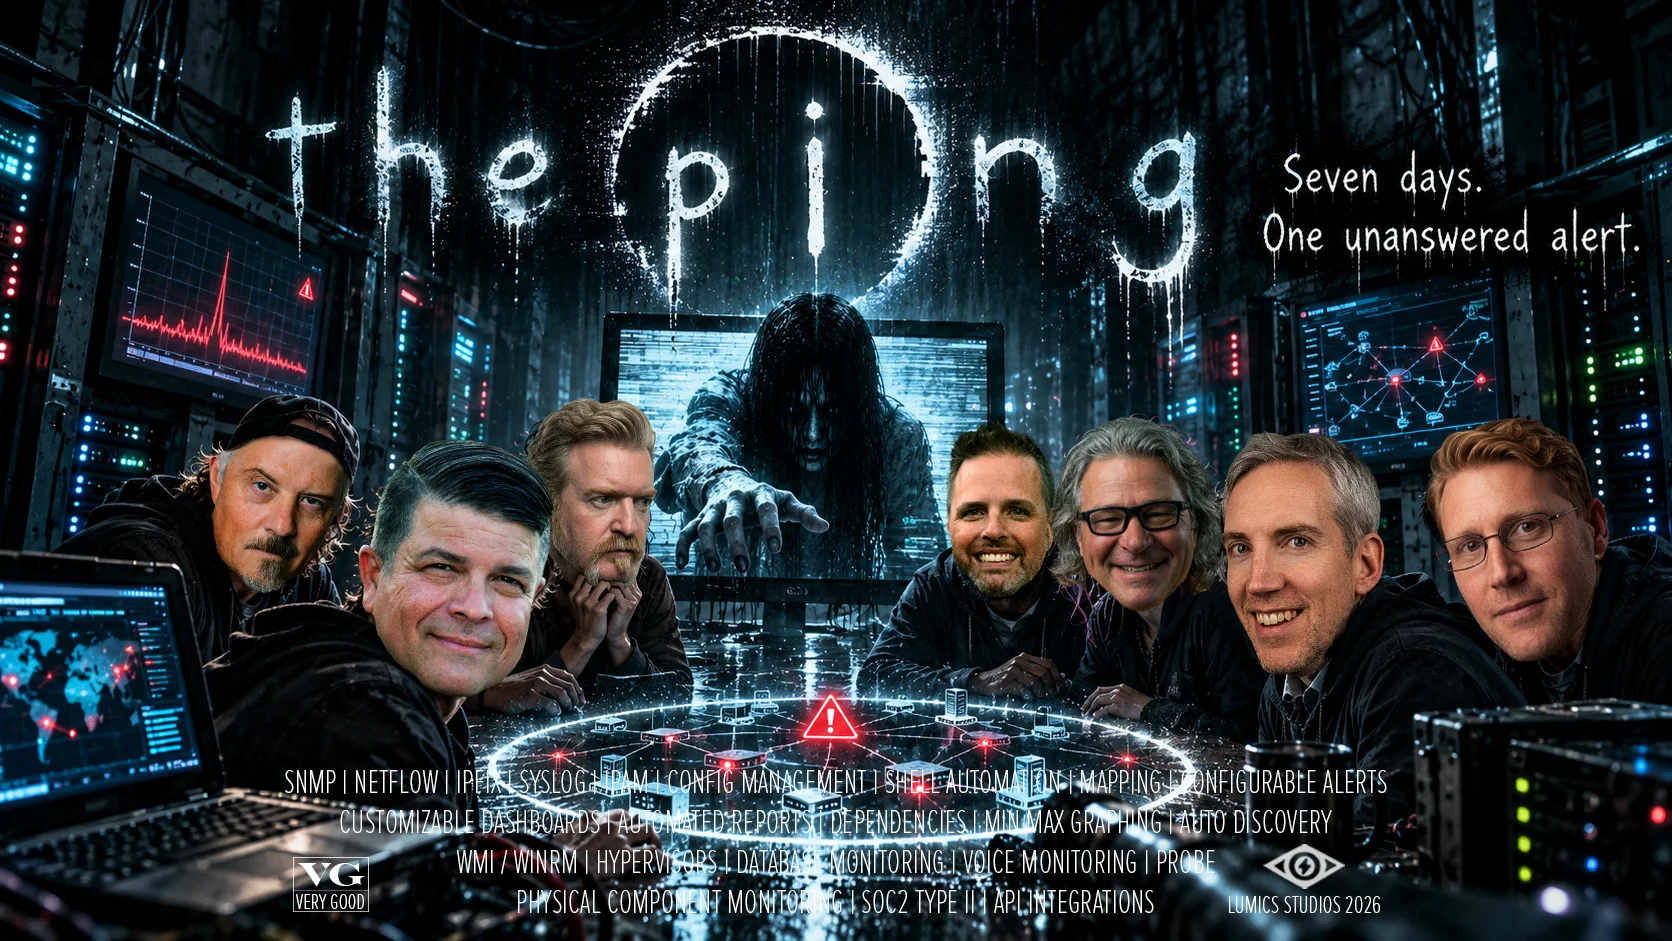
The Ping
10.30.2026
🎬 THE PING 📺
Seven days. One unanswered alert.
In the 2002 horror classic The Ring, watching a mysterious videotape starts a terrifying countdown.
Seven days later… well, let’s just say the consequences of ignoring the warning aren’t pretty. 😱
Sound familiar, IT teams?
An interface starts dropping packets.
A server experiences intermittent CPU spikes.
Latency suddenly jumps to 800ms, then returns to normal.
An application slows down for a few seconds, but nobody can figure out why.
The warning signs are there. But they’re easy to miss.
And unlike a horror movie, your network doesn’t give you seven days before disaster strikes.
That’s why Lumics helps IT teams uncover the things that go bump in the network.
👻 See the invisible. Automatic discovery and topology mapping reveal devices, connections, and dependencies you might not even know exist.
👻 Catch the disappearing spikes. Lumics’ true min/max graphing exposes brief performance anomalies that traditional averaging can make vanish like ghosts.
👻 Don’t ignore the warnings. Highly customizable alerts help you identify meaningful problems early, without drowning in notification noise.
👻 Investigate the haunting. Historical telemetry and synchronized Top X widgets help correlate events across your infrastructure and pinpoint what actually happened.
👻 Follow the suspicious traffic. NetFlow monitoring reveals bandwidth hogs, unusual traffic patterns, and the top talkers lurking in the shadows.
👻 Keep everyone in the loop. Customizable, shareable dashboards provide real-time visibility across networks, servers, storage, virtualization, and more.
The scariest network problems aren’t necessarily the ones that bring everything crashing down.
They’re the ones hiding in your infrastructure while your monitoring dashboard insists everything is fine.
🎬 Fun fact: The creepy, distorted videotape featured in The Ring was deliberately created to feel like something viewers weren’t supposed to see.
And here’s a particularly chilling bit of movie history: The film’s marketing campaign included distributing the mysterious videotape footage without identifying it as a movie promotion, leaving some unsuspecting viewers wondering what they’d just watched.
It was an ingenious way to turn an ordinary piece of technology into something terrifying.
Of course, in IT, the truly terrifying thing isn’t a mysterious videotape.
It’s a monitoring dashboard that says everything is normal when your users know otherwise. 👀
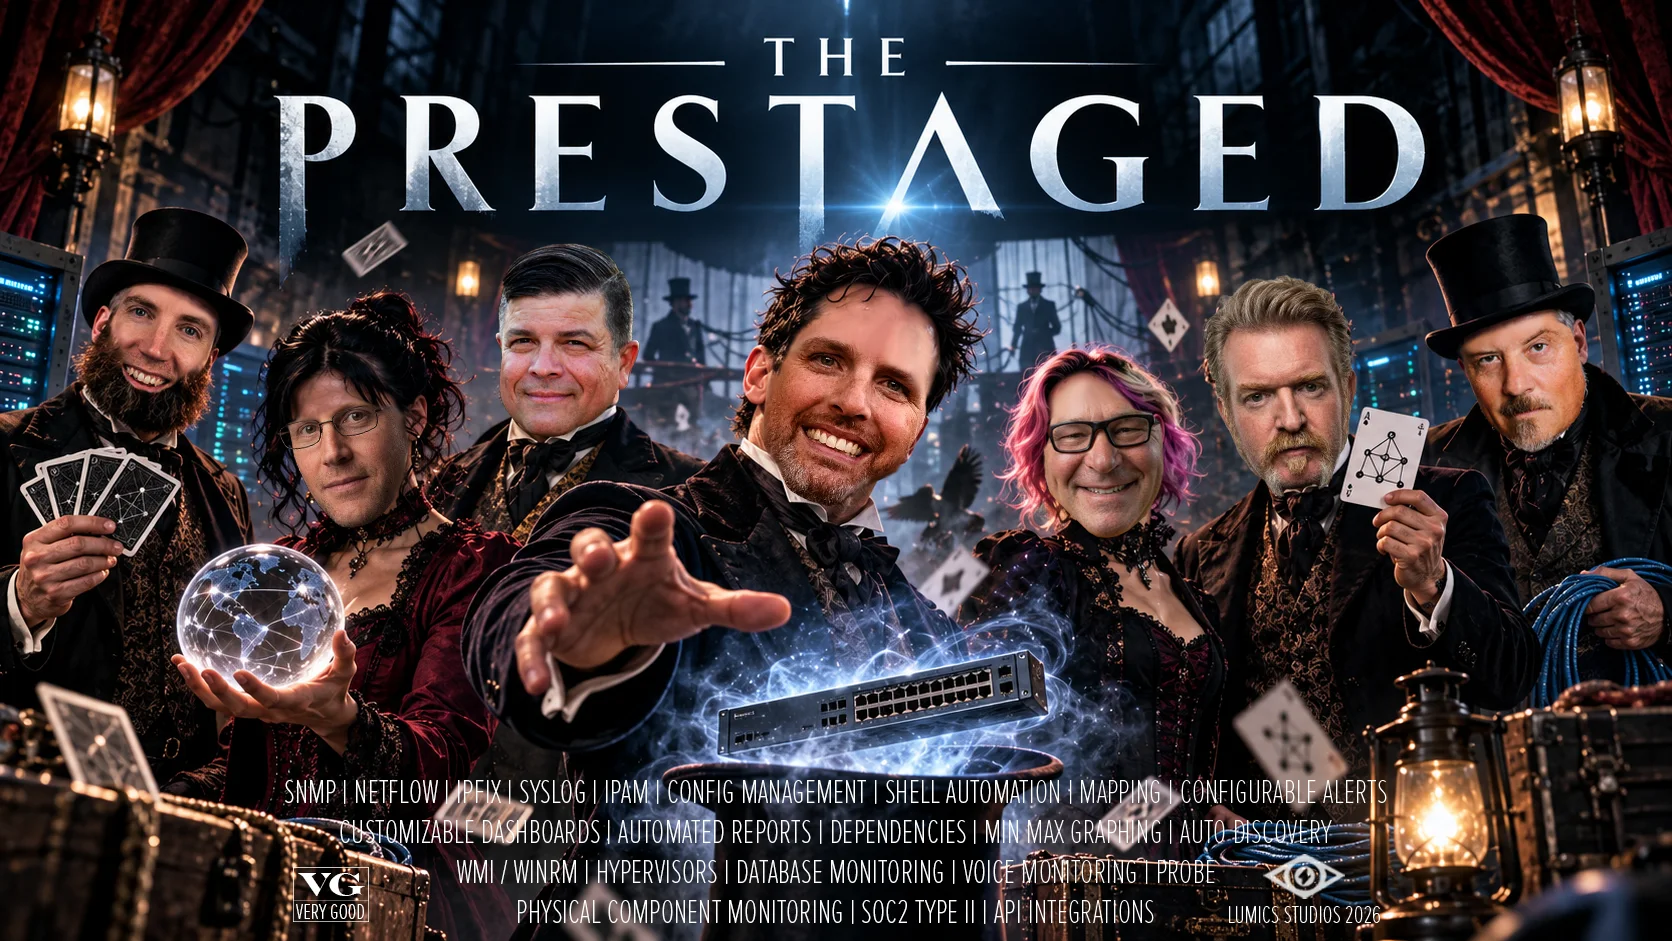
The Prestaged
10.23.2026
🎩 THE PRESTAGED ✨
Are you watching closely?
In Christopher Nolan’s The Prestige – which hit theaters twenty years ago in Oct 2006 – two rival magicians dedicate their lives to creating the ultimate illusion.
Their greatest skill? Making the impossible look effortless.
And their greatest secret? What the audience doesn’t see.
Sound familiar, IT professionals?
Your network monitoring dashboard shows everything is green. CPU utilization looks normal. Latency is averaging just a few milliseconds. No major alarms.
But users are complaining. Applications are crawling. Something isn’t right.
Congratulations. You’ve just witnessed the disappearing performance problem. 🪄
The trick? Data averaging.
A 10-second spike to 100% CPU can disappear into a five-minute average. A brief burst of network congestion can become virtually invisible. And a latency spike that disrupted hundreds of users might never appear on your graph.
At Lumics, we believe your monitoring tool shouldn’t be performing magic tricks with your data.
🎩 The Pledge : Know what you’re looking at. Automatic discovery and topology mapping reveal the devices, connections, and dependencies across your infrastructure.
🪄 The Turn : Watch the unexpected happen. True min/max graphing exposes the short-lived spikes and anomalies that traditional averaging can make disappear.
✨ The Prestige : Reveal the secret. Historical telemetry, synchronized Top X widgets, and NetFlow analysis help you correlate events, identify the culprits, and uncover the root cause.
And the magic doesn’t stop there.
Highly customizable alerts help you catch problems before they become full-blown incidents.
Integrated syslog, configuration management, and IPAM provide the additional clues needed to complete your investigation.
Shareable dashboards give everyone, from network engineers to executives, a clear view of what’s really happening.
Because when your infrastructure is mission-critical, the last thing you need is a monitoring platform that’s good at making problems disappear.
🎬 Fun fact: The Prestige features a fascinating piece of casting: legendary musician David Bowie plays inventor Nikola Tesla.
Director Christopher Nolan specifically pursued Bowie for the role, believing his extraordinary public persona made him uniquely suited to portray the mysterious inventor. Bowie initially declined, but Nolan personally persuaded him to join the film.
And Tesla’s inventions play a crucial role in the movie’s biggest illusion.
It’s a fitting reminder that behind every seemingly impossible feat is technology that most people don’t fully understand.
Fortunately, understanding your network shouldn’t require a magician, or Nikola Tesla.
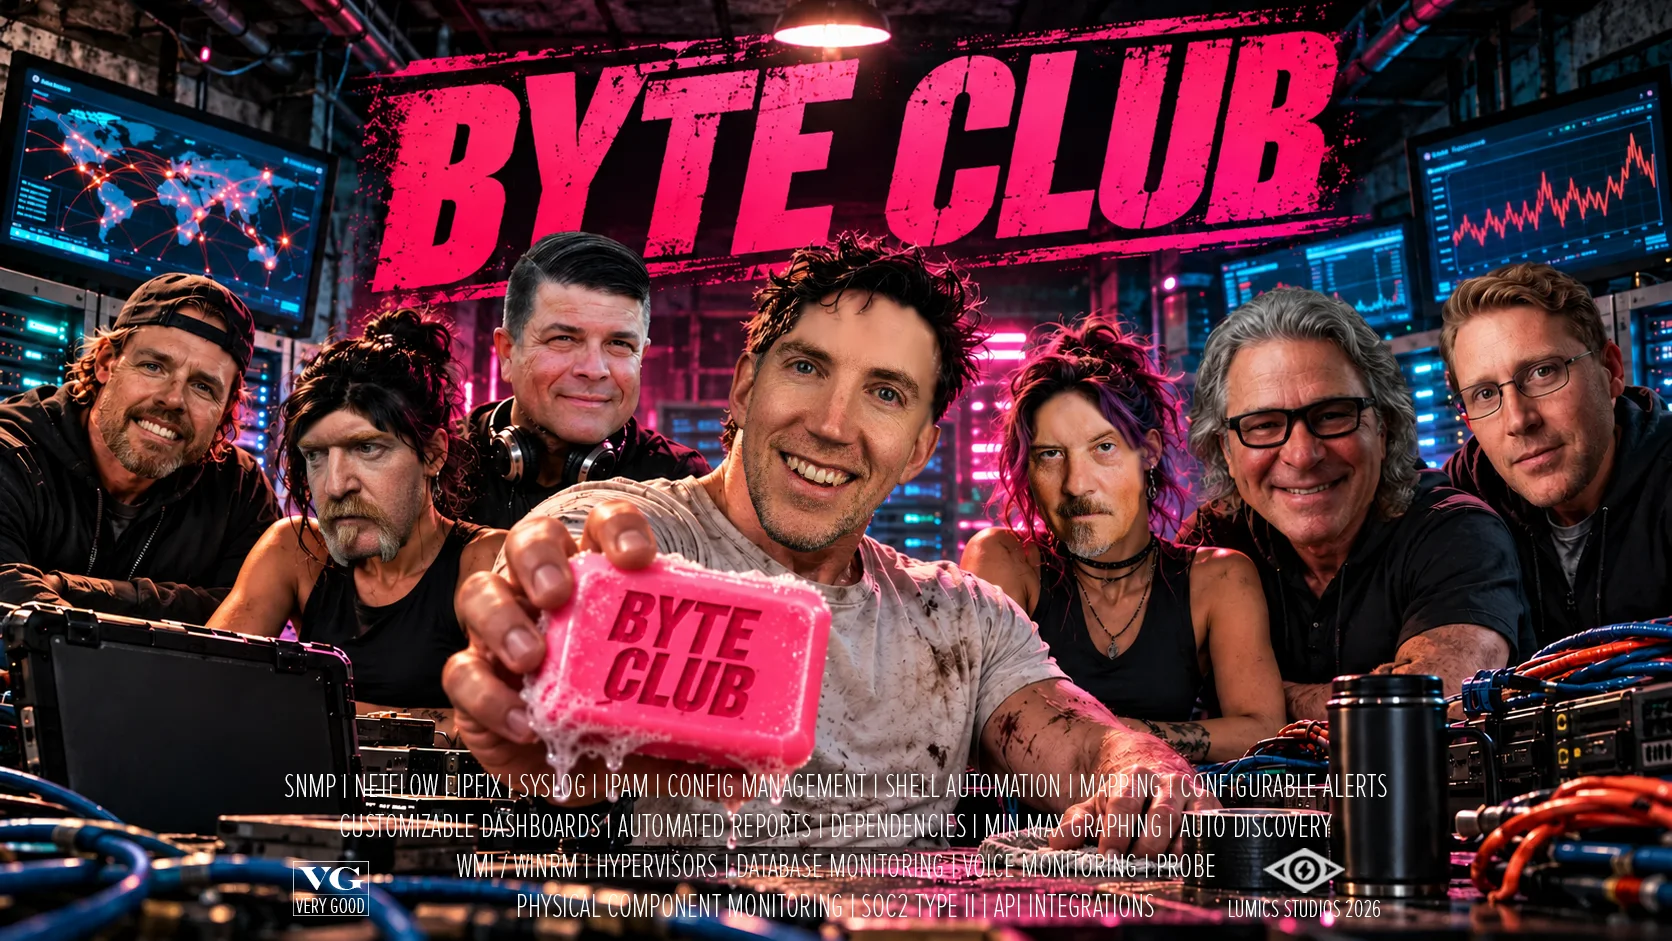
The Byte Club
10.16.2026
Remember when 1999 was the end of the world? All the computers were going to glitch and hurl society into complete chaos.
That October, Fight Club hit the big screens. Epic movie. Mixed reviews at first.
17 years later, Lumics unofficially launched Byte Club. It wasn’t called that at the time. Still isn’t. This is just a metaphor.
🎬 BYTE CLUB
The first rule of Byte Club? What happens in Byte Club stays in Byte Club.
The second rule of Byte Club? NEVER trust an average.
Because in network monitoring, the most dangerous problems aren’t always the ones that knock everything offline.
They’re the ones hiding in plain sight.
A 10-second latency spike. A sudden burst of bandwidth consumption. A server that briefly hits 100% CPU. A network interface dropping packets just long enough to disrupt an application.
And then… everything looks normal again.
Your monitoring dashboard says everything is fine.
Your users disagree. 😬
Welcome to Byte Club.
At Lumics, we believe IT teams shouldn’t have to fight their monitoring tools just to figure out what’s happening in their infrastructure.
🥊 Fight the averages. Lumics’ true min/max graphing exposes short-lived performance spikes and anomalies that traditional averaging can make disappear.
🥊 Know your opponents. Automatic network discovery and topology mapping reveal the devices, connections, and dependencies across your infrastructure.
🥊 Follow the evidence. Historical monitoring data and synchronized Top X widgets help correlate performance problems with the devices and traffic responsible.
🥊 Find the bandwidth bullies. NetFlow visibility identifies top talkers, traffic patterns, and the sources of congestion.
🥊 Stop fighting false alarms. Highly customizable alerts help teams focus on meaningful issues instead of drowning in notification noise.
🥊 One club. One view. Shareable dashboards bring network, server, storage, virtualization, and other infrastructure data together so everyone can work from the same intelligence.
Because the goal isn’t to win a fight against your network.
It’s to understand your network well enough that you don’t have to fight it in the first place.
🎥 Fun fact: When Fight Club was released on October 15, 1999, it was a box-office disappointment in North America and received sharply divided reviews.
But the film found a massive audience on DVD, eventually becoming one of the most recognizable cult classics of its generation.
There’s a lesson there for IT teams:
Sometimes the most important story isn’t obvious from the first set of numbers.
You have to look deeper.
And that’s exactly what Lumics helps you do.
🥊 BYTE CLUB
The first rule of Byte Club: Never trust an average.
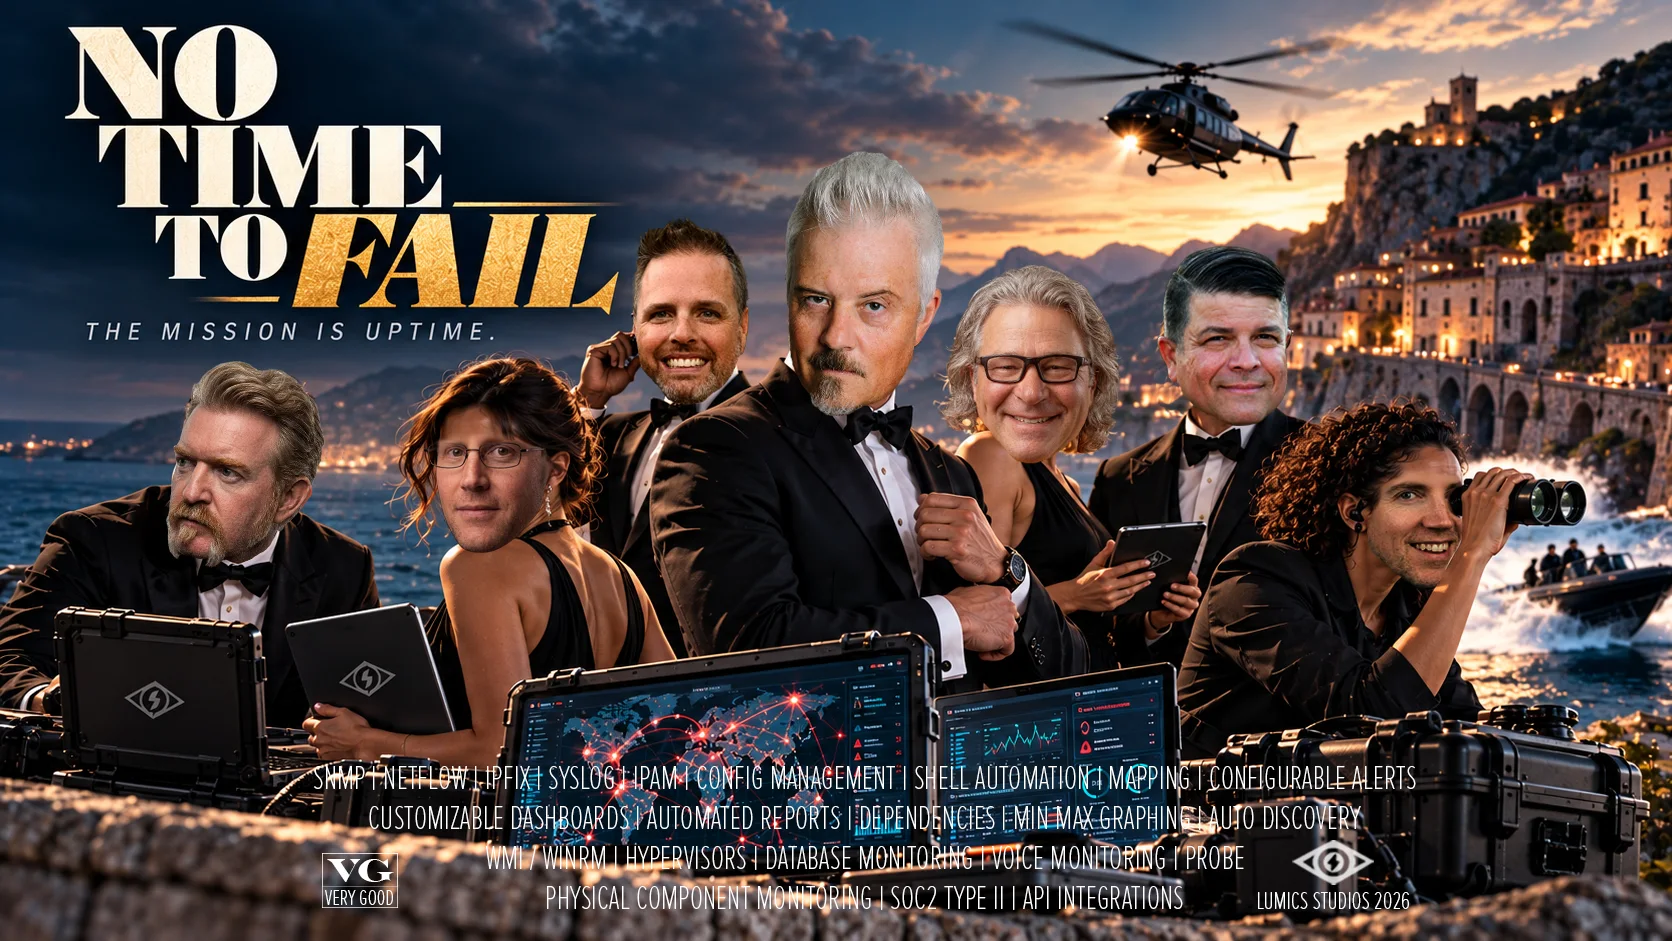
No Time To Fail
10.09.2026
🎬 NO TIME TO FAIL 🕶️
The mission is uptime.
In the world of James Bond, every second counts.
One missed signal. One overlooked threat. One wrong move. And suddenly, the entire mission is in jeopardy.
Sound familiar, IT teams?
Your infrastructure may not involve international espionage, high-speed chases, or villains plotting world domination (although some Monday mornings might feel that way)… 😎
But when critical applications slow down, networks become congested, or infrastructure starts failing, you don’t have the luxury of waiting for the next incident report.
You need intelligence. You need visibility. And you need answers, fast.
That’s where Lumics comes in.
Know your environment. Automatic discovery and topology mapping help you understand what’s connected, what’s changing, and where problems might originate.
Catch what others miss. True min/max graphing exposes brief latency spikes, performance anomalies, and resource utilization peaks that traditional averaging can hide.
Get the right intelligence. Highly customizable alerts help your team focus on genuine threats instead of drowning in false alarms and notification noise.
Follow the traffic. NetFlow visibility helps identify bandwidth hogs, unusual traffic patterns, and the Top Talkers behind network congestion.
See the entire operation. Unified dashboards bring networks, servers, storage, virtualization, databases, and more into one clear picture, shareable with everyone from the NOC to the executive team.
Leave no clues behind. Integrated syslog, configuration management, and IPAM provide the additional context needed to investigate problems without constantly switching tools.
The best IT teams don’t just react when something breaks.
They spot the warning signs, connect the evidence, and resolve problems before the mission is compromised.
And unlike 007, you shouldn’t need an entire Q Branch just to figure out why your network is slow.
🎬 Fun fact: No Time to Die (Oct 8, 2021) was the first James Bond film to feature sequences shot with IMAX film cameras. Director Cary Joji Fukunaga used the larger format for major action sequences, giving audiences a much bigger picture of the action.
Which brings us to a familiar challenge in network monitoring:
You can’t respond to what you can’t see.
When your monitoring tools only show part of the picture, or average away the details that matter, even the best IT team can miss the critical clue.
Lumics helps you see the bigger picture without losing the important details.
🎥 NO TIME TO FAIL
The mission is uptime.
Your infrastructure is mission-critical. Your monitoring should be, too.
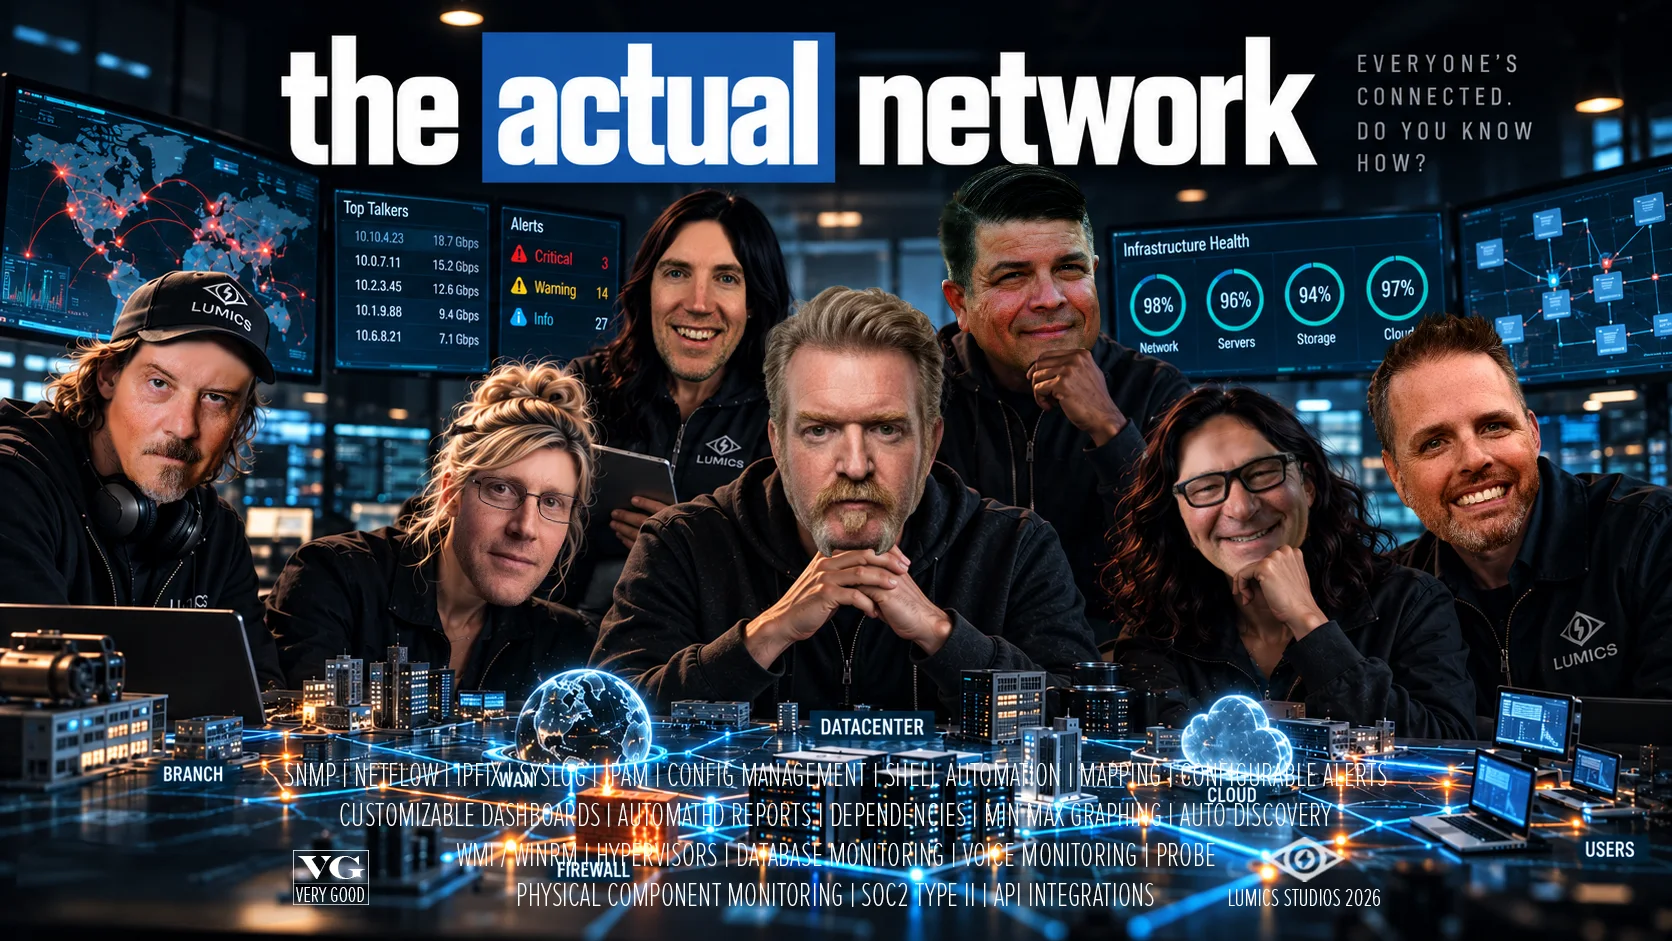
The Actual Network
10.02.2026
The mission is uptime.
In the world of James Bond, every second counts.
One missed signal. One overlooked threat. One wrong move. And suddenly, the entire mission is in jeopardy.
Sound familiar, IT teams?
Your infrastructure may not involve international espionage, high-speed chases, or villains plotting world domination (although some Monday mornings might feel that way)… 😎
But when critical applications slow down, networks become congested, or infrastructure starts failing, you don’t have the luxury of waiting for the next incident report.
You need intelligence. You need visibility. And you need answers, fast.
That’s where Lumics comes in.
Know your environment. Automatic discovery and topology mapping help you understand what’s connected, what’s changing, and where problems might originate.
Catch what others miss. True min/max graphing exposes brief latency spikes, performance anomalies, and resource utilization peaks that traditional averaging can hide.
Get the right intelligence. Highly customizable alerts help your team focus on genuine threats instead of drowning in false alarms and notification noise.
Follow the traffic. NetFlow visibility helps identify bandwidth hogs, unusual traffic patterns, and the Top Talkers behind network congestion.
See the entire operation. Unified dashboards bring networks, servers, storage, virtualization, databases, and more into one clear picture, shareable with everyone from the NOC to the executive team.
Leave no clues behind. Integrated syslog, configuration management, and IPAM provide the additional context needed to investigate problems without constantly switching tools.
The best IT teams don’t just react when something breaks.
They spot the warning signs, connect the evidence, and resolve problems before the mission is compromised.
And unlike 007, you shouldn’t need an entire Q Branch just to figure out why your network is slow.
🎬 Fun fact: No Time to Die (Oct 8, 2021) was the first James Bond film to feature sequences shot with IMAX film cameras. Director Cary Joji Fukunaga used the larger format for major action sequences, giving audiences a much bigger picture of the action.
Which brings us to a familiar challenge in network monitoring:
You can’t respond to what you can’t see.
When your monitoring tools only show part of the picture, or average away the details that matter, even the best IT team can miss the critical clue.
Lumics helps you see the bigger picture without losing the important details.
🎥 NO TIME TO FAIL
The mission is uptime.
Your infrastructure is mission-critical. Your monitoring should be, too.
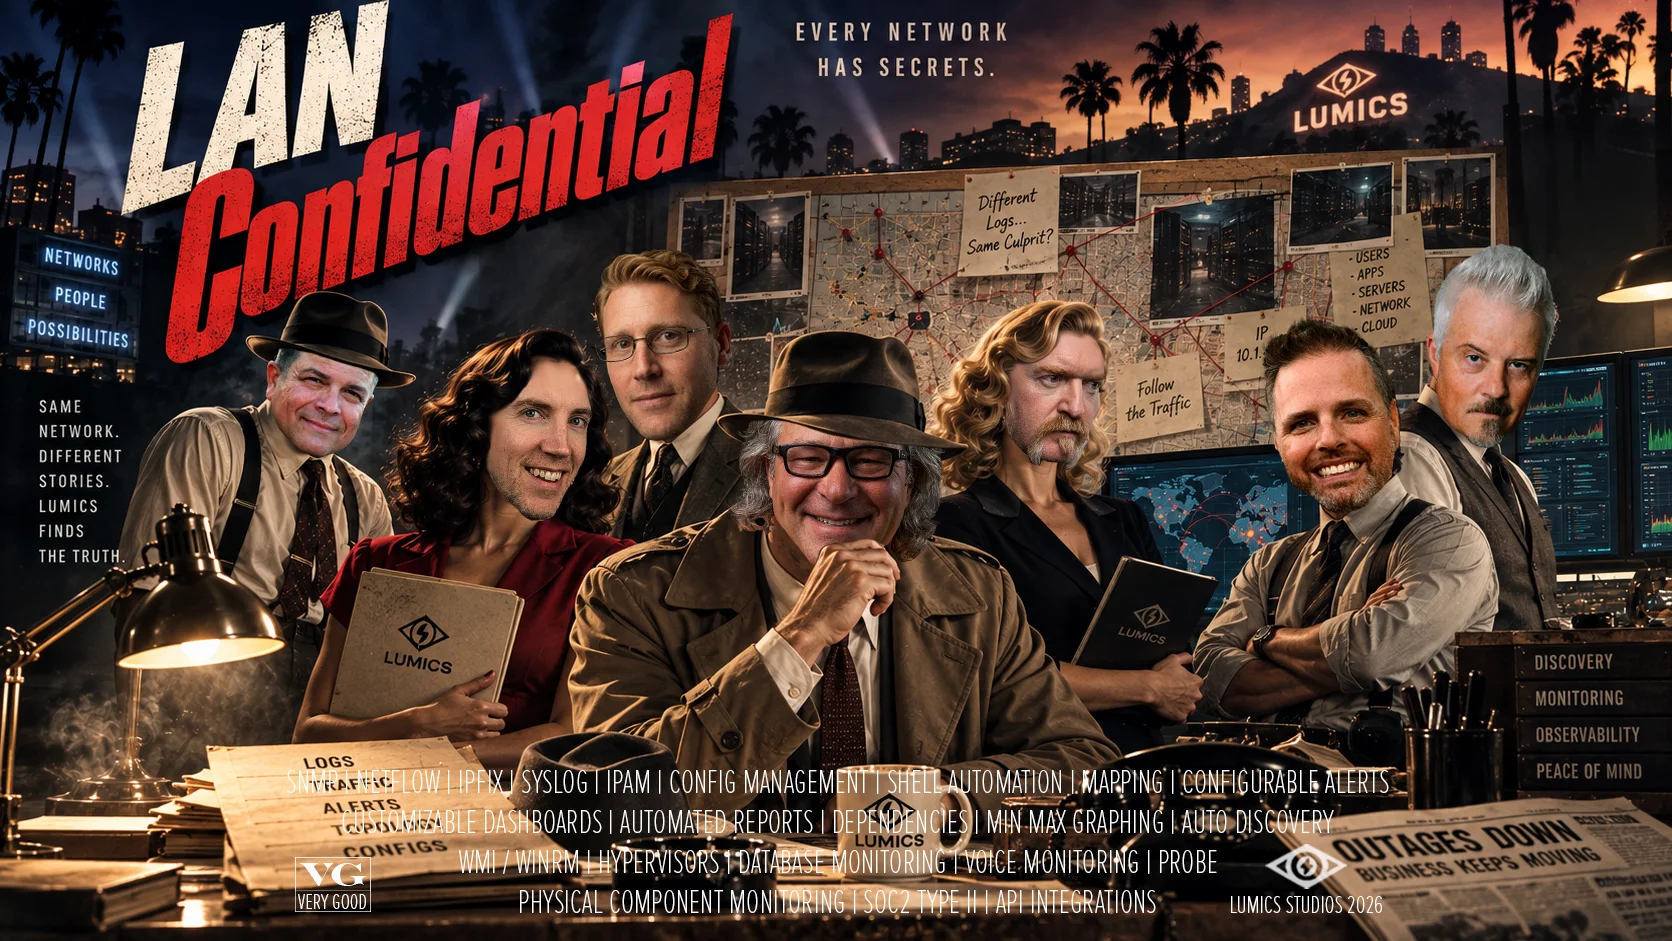
LAN Confidential
09.25.2026
🕵️♂️ Every network has secrets.
A latency spike that disappears before anyone investigates it.
A device nobody knew was connected.
A bandwidth hog quietly consuming the WAN.
A configuration change that happened right before everything went sideways.
And just like any good detective story, the first clue isn’t always the culprit.
That’s why troubleshooting requires more than knowing something is wrong.
You need the evidence to figure out what happened, where it started, and how everything connects.
That’s where Lumics comes in.
Discovery & topology: Know what’s actually on your network and how it’s connected.
True min/max graphing: Catch the brief spikes and anomalies that averages can hide.
NetFlow: Follow the traffic and identify the real Top Talkers.
Syslog & Configuration Management: Dig into the evidence and understand what changed.
Customizable alerts: Focus your investigators on the clues that actually matter.
Unified infrastructure visibility: Correlate what’s happening across networks, servers, storage, virtualization, databases and more.
Because when users say… “The network is slow.”
…that’s not the answer.
That’s the beginning of the investigation.
🎬 Fun fact: L.A. Confidential author James Ellroy reportedly thought his sprawling novel was essentially unfilmable. Screenwriters Brian Helgeland and Curtis Hanson had to dramatically condense its characters and interconnected storylines while preserving the core relationships and themes. Their adaptation worked out pretty well: they won the Academy Award for Best Adapted Screenplay.
Which seems appropriate for network monitoring:
Lots of characters. Lots of connections. Lots of conflicting clues.
The trick is seeing how they all fit together.
LAN CONFIDENTIAL
Every network has secrets.
Follow the evidence. Find the truth.
Posts

The Case Against 5-Minute Polling Intervals: What Your Network Monitoring Might Be Missing
A network issue doesn't need to last five minutes to disrupt your business. When monitoring platforms rely on traditional five-minute polling intervals, short-lived traffic spikes, packet loss, and outages can vanish between measurements—or get averaged away completely. Discover why modern[...]

How to Choose Network Monitoring Software: 12 Questions to Ask Before You Buy
Most network monitoring platforms look identical during a sales demo, but perform completely differently during a real outage. From polling frequency and spike preservation to hidden licensing costs and practical AI, here are 12 essential questions IT teams must ask[...]
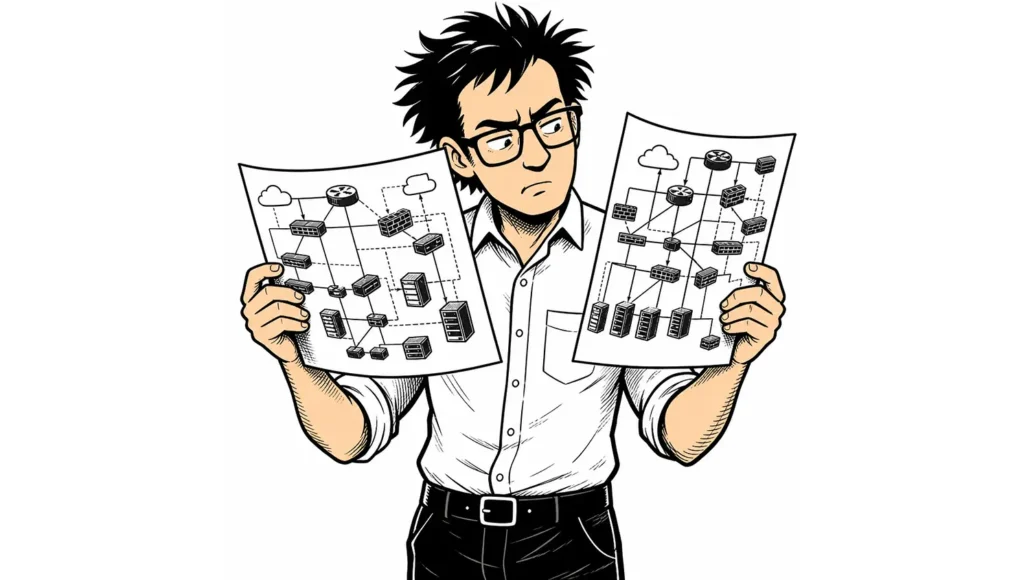
Network Monitoring vs. Network Observability: What’s the Difference?
While "observability" is often framed as the shiny replacement for "monitoring," the two aren't mutually exclusive—they depend on each other. Monitoring detects the symptom (like a WAN utilization spike), while observability provides the context (identifying the specific flow, config change,[...]

Your Monitoring Platform Says Everything Is Fine. Your Users Disagree.
Every engineer knows the scenario: users report severe network slowness, but your monitoring dashboard displays healthy green devices across the board. The issue isn't that your users are wrong—it's that availability ("up") is not performance, and traditional platforms average away[...]

The 5 Hidden Costs of Slow Network Monitoring Software
Is your network monitoring software slowing you down? Discover 5 hidden costs, including increased downtime, missed anomalies, and wasted engineering resources.[...]

Why Historical Data Is Worthless If You Can’t Explore It
Is your historical monitoring data actually useful? Learn why granular retention, min/max graphing, and synchronized exploration are essential for actionable troubleshooting.[...]
Playlists
Here are a few of the channels we’re currently listening to…