
By Lumics | November 6, 2026 | 8 min read
Key Takeaways
- Five-minute polling intervals can miss short-lived network and infrastructure problems that occur between measurements.
- A device can experience severe performance issues and recover before the next monitoring poll ever happens.
- Faster polling improves visibility into brief events, but the ideal frequency depends on the metric, device, and operational requirements.
- Min/max graphing helps preserve important performance extremes that traditional averaged graphs can hide.
- Effective monitoring combines appropriate polling intervals, accurate historical data, and tools that make anomalies easy to investigate.
Imagine you’re driving down the highway.
Every five minutes, someone takes a picture of your speedometer.
At 10:00, you’re traveling 65 mph.
At 10:05, you’re traveling 65 mph.
At 10:10, you’re traveling 65 mph.
According to those pictures, your speed never changed.
But what if you accelerated to 110 mph for 2 minutes between pictures?
What if you slammed on the brakes?
What if you came to a complete stop?
None of those events would appear in the record.
That’s essentially what can happen when network monitoring polling intervals are set to five minutes.
Your monitoring platform may be collecting perfectly accurate measurements.
It’s just not collecting them often enough to see everything that matters.
Why Five-Minute Polling Became So Common
Five-minute polling intervals have been a common default in network monitoring for decades.
And historically, there were good reasons for that.
Polling devices more frequently required additional processing, network traffic, and storage.
Monitoring servers had limited resources.
Networks were smaller, but the tools available to monitor them were also less capable.
Collecting and retaining detailed performance information could become expensive.
Five minutes represented a practical compromise.
It provided enough information to understand broad utilization trends without overwhelming the monitoring infrastructure.
And for some measurements, five-minute polling is still perfectly reasonable.
But modern networks have changed dramatically.
Applications communicate constantly.
Virtualized workloads can change resource consumption in seconds.
Cloud services generate unpredictable traffic patterns.
Backups, file transfers, and automated processes can create sudden bursts of activity.
Users expect applications to respond immediately.
A performance problem doesn’t need to last five minutes to create a significant business impact.
So why should your monitoring platform need five minutes to notice it?
A Lot Can Happen in 300 Seconds
Five minutes might not sound like much.
Until you’re troubleshooting an outage.
Consider a WAN circuit connecting a remote office to a critical application.
At 2:00 PM, utilization is 24%.
At 2:01 PM, a large data transfer begins.
The circuit becomes saturated. Latency increases. Packets are dropped.
Users experience slow applications and failed connections.
At 2:04 PM, the transfer completes.
Everything returns to normal.
At 2:05 PM, the monitoring platform polls the interface again.
Utilization is 27%.
What does the graph show?
Two healthy measurements.
The entire incident happened between them.
And unless another collection mechanism captured the event, the monitoring platform has no record of the problem.
The users experienced it. The applications experienced it. The network experienced it.
Your monitoring platform simply wasn’t looking.
Polling Frequency Determines What You Can See
A polling interval is the amount of time between measurements collected by your monitoring platform.
Common intervals include:
- 15 seconds
- 30 seconds
- 60 seconds
- 5 minutes
- 10 minutes or longer
The shorter the interval, the more opportunities the platform has to observe changes in infrastructure behavior.
But there’s an important distinction.
Polling more frequently doesn’t guarantee that every short-lived event will be captured.
For example, CPU utilization might be reported as an instantaneous value or as an average over an internal measurement period, depending on the device and metric.
An interface bandwidth measurement is often calculated from changes in cumulative byte counters between polls.
That means a five-minute utilization graph might represent the average traffic rate across the entire five-minute interval rather than a single instantaneous reading.
A brief period of saturation can still be diluted by the surrounding lower utilization.
Even when the monitoring system successfully collects the data, the event may not appear as the severe spike that users actually experienced.
Shorter intervals can reduce this smoothing effect, making transient events easier to identify.
The Difference Between Missing a Problem and Averaging It Away
These are two related but distinct problems.
The first is a collection problem. The monitoring platform never captured the event.
The second is a presentation or retention problem. The monitoring platform collected useful measurements but later combined them into averages that concealed important details.
Both can lead to the same frustrating outcome.
A user reports a problem. The monitoring graphs look normal. And the engineer has no obvious explanation.
Let’s look at a simple example.
Suppose a monitoring platform collects the following utilization measurements over a short period:
| Measurement | Utilization |
| 1 | 22% |
| 2 | 25% |
| 3 | 100% |
| 4 | 28% |
| 5 | 24% |
The average utilization is approximately 40%.
That’s not necessarily alarming.
But the maximum utilization was 100%.
That is potentially very important.
If the platform only displays the average, the most interesting measurement in the entire dataset becomes difficult to see.
That’s why polling frequency and graphing accuracy need to work together.
Collecting more data is valuable.
Preserving what makes that data important is equally valuable.
Why Min/Max Graphing Matters
Traditional averaged graphs are good at showing general trends.

Imagine you’re driving down the highway.
Every five minutes, someone takes a picture of your speedometer.
At 10:00, you’re traveling 65 mph.
At 10:05, you’re traveling 65 mph.
At 10:10, you’re traveling 65 mph.
According to those pictures, your speed never changed.
But what if you accelerated to 110 mph for 2 minutes between pictures?
What if you slammed on the brakes?
What if you came to a complete stop?
None of those events would appear in the record.
That’s essentially what can happen when network monitoring polling intervals are set to five minutes.
Your monitoring platform may be collecting perfectly accurate measurements.
It’s just not collecting them often enough to see everything that matters.
Why Five-Minute Polling Became So Common
Five-minute polling intervals have been a common default in network monitoring for decades.
And historically, there were good reasons for that.
Polling devices more frequently required additional processing, network traffic, and storage.
Monitoring servers had limited resources.
Networks were smaller, but the tools available to monitor them were also less capable.
Collecting and retaining detailed performance information could become expensive.
Five minutes represented a practical compromise.
It provided enough information to understand broad utilization trends without overwhelming the monitoring infrastructure.
And for some measurements, five-minute polling is still perfectly reasonable.
But modern networks have changed dramatically.
Applications communicate constantly.
Virtualized workloads can change resource consumption in seconds.
Cloud services generate unpredictable traffic patterns.
Backups, file transfers, and automated processes can create sudden bursts of activity.
Users expect applications to respond immediately.
A performance problem doesn’t need to last five minutes to create a significant business impact.
So why should your monitoring platform need five minutes to notice it?
A Lot Can Happen in 300 Seconds
Five minutes might not sound like much.
Until you’re troubleshooting an outage.
Consider a WAN circuit connecting a remote office to a critical application.
At 2:00 PM, utilization is 24%.
At 2:01 PM, a large data transfer begins.
The circuit becomes saturated. Latency increases. Packets are dropped.
Users experience slow applications and failed connections.
At 2:04 PM, the transfer completes.
Everything returns to normal.
At 2:05 PM, the monitoring platform polls the interface again.
Utilization is 27%.
What does the graph show?
Two healthy measurements.
The entire incident happened between them.
And unless another collection mechanism captured the event, the monitoring platform has no record of the problem.
The users experienced it. The applications experienced it. The network experienced it.
Your monitoring platform simply wasn’t looking.
Polling Frequency Determines What You Can See
A polling interval is the amount of time between measurements collected by your monitoring platform.
Common intervals include:
- 15 seconds
- 30 seconds
- 60 seconds
- 5 minutes
- 10 minutes or longer
The shorter the interval, the more opportunities the platform has to observe changes in infrastructure behavior.
But there’s an important distinction.
Polling more frequently doesn’t guarantee that every short-lived event will be captured.
For example, CPU utilization might be reported as an instantaneous value or as an average over an internal measurement period, depending on the device and metric.
An interface bandwidth measurement is often calculated from changes in cumulative byte counters between polls.
That means a five-minute utilization graph might represent the average traffic rate across the entire five-minute interval rather than a single instantaneous reading.
A brief period of saturation can still be diluted by the surrounding lower utilization.
Even when the monitoring system successfully collects the data, the event may not appear as the severe spike that users actually experienced.
Shorter intervals can reduce this smoothing effect, making transient events easier to identify.
The Difference Between Missing a Problem and Averaging It Away
These are two related but distinct problems.
The first is a collection problem. The monitoring platform never captured the event.
The second is a presentation or retention problem. The monitoring platform collected useful measurements but later combined them into averages that concealed important details.
Both can lead to the same frustrating outcome.
A user reports a problem. The monitoring graphs look normal. And the engineer has no obvious explanation.
Let’s look at a simple example.
Suppose a monitoring platform collects the following utilization measurements over a short period:
| Measurement | Utilization |
| 1 | 22% |
| 2 | 25% |
| 3 | 100% |
| 4 | 28% |
| 5 | 24% |
The average utilization is approximately 40%.
That’s not necessarily alarming.
But the maximum utilization was 100%.
That is potentially very important.
If the platform only displays the average, the most interesting measurement in the entire dataset becomes difficult to see.
That’s why polling frequency and graphing accuracy need to work together.
Collecting more data is valuable.
Preserving what makes that data important is equally valuable.
Why Min/Max Graphing Matters
Traditional averaged graphs are good at showing general trends.
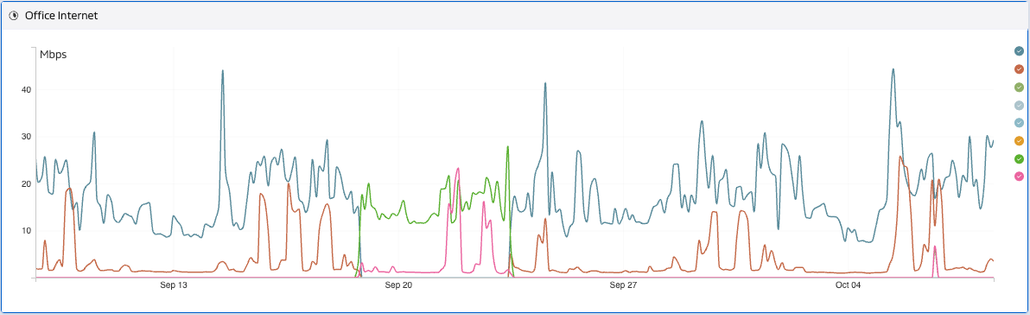
They’re not always good at revealing extremes.
Min/max graphing provides additional context by showing the highest and lowest measurements recorded within a reporting period.
Instead of displaying only the average utilization, engineers can see that an interface briefly reached 100%.
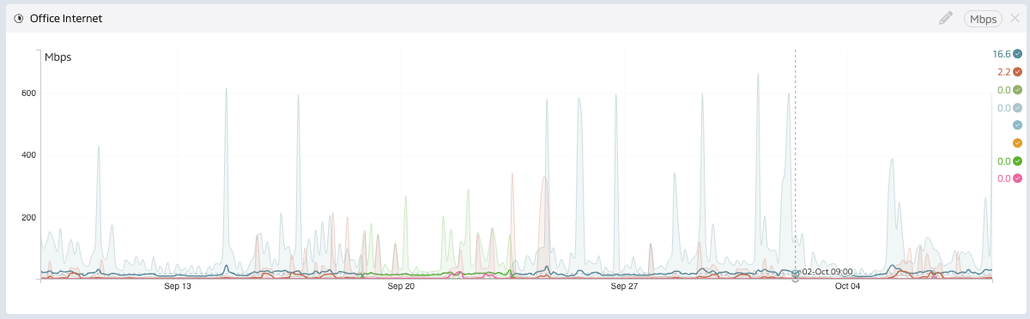
That matters because network and infrastructure problems frequently occur at the extremes.
A sudden CPU spike.
A brief memory utilization peak.
A burst of network congestion.
An unexpected drop in available resources.
A short-lived latency increase.
These events may be exactly what an engineer needs to investigate.
Lumics uses min/max graphing to preserve the important peaks and valleys in collected performance data.
This doesn’t magically reconstruct events that were never measured.
But it helps ensure that meaningful extremes within the collected data aren’t hidden by the averaging process.
The distinction is important.
Faster polling helps capture more detail.
Min/max graphing helps preserve and reveal that detail.
Together, they provide a much more useful picture of infrastructure behavior.
Five-Minute Polling Can Also Delay Alerts
There’s another consequence of infrequent polling.
Detection time.
Suppose a critical server fails immediately after a successful poll.
If the platform checks every five minutes, the next scheduled measurement may not occur for almost five minutes.
Depending on the monitoring configuration, alerting logic, retries, and notification delivery, the actual alert may take even longer.
For a noncritical device, that might be acceptable.
For a critical production system, it might not be.
Every minute between the beginning of an incident and its detection adds time to the troubleshooting process.
And detection is only the first step.
Someone still needs to receive the alert. Investigate the problem. Identify the cause. And resolve it.
If your monitoring platform starts that process several minutes late, you’re already behind.
Event-driven mechanisms such as SNMP traps, syslog, and other notifications can help identify certain changes between scheduled polls.
But those mechanisms complement polling rather than replacing the need for accurate performance measurements.
Not Everything Needs to Be Polled Every 15 Seconds
Now, before we declare five-minute polling completely obsolete, there’s an important qualification.
Not every metric needs the same collection frequency.
A critical WAN interface might warrant more frequent monitoring than a rarely used printer.
A production database server might need more detailed performance measurements than a development machine that sits idle most of the day.
Some metrics change rapidly.
Others change slowly.
Some devices can comfortably support frequent polling.
Others may have resource limitations.
And polling large environments more frequently increases the work required of the monitoring platform.
That’s why the best approach isn’t necessarily to poll everything as fast as possible.
It’s to choose collection intervals based on operational importance, expected behavior, and the capabilities of the infrastructure.
The problem with five-minute polling isn’t that it’s always wrong.
The problem is treating five minutes as universally sufficient.
Historical Retention Makes the Problem Even More Important
Polling frequency affects the data you collect today.
Historical retention determines what you’ll still be able to investigate tomorrow.
Some monitoring platforms collect relatively detailed measurements initially, then progressively average or downsample that information as it ages.
That can create an unfortunate situation.
An engineer investigates a problem from yesterday and sees a clear spike.
A month later, someone asks about the same event.
Now the spike is gone.
The platform still retains historical data.
But it no longer retains the same level of useful detail.
That’s why organizations should evaluate polling, graphing, and retention together.
Ask your monitoring vendor:
- How frequently is the data collected?
- How are measurements represented?
- What happens to the data after 30 days?
- What happens after six months?
- Are minimum and maximum values preserved?
- Can engineers still investigate brief anomalies in older data?
Historical data shouldn’t become less useful simply because it gets older.
Correlation Turns Measurements Into Answers
Capturing an anomaly is only the beginning.
Suppose your monitoring platform shows that a WAN circuit experienced a significant utilization spike at 11:42 AM.
That’s helpful.
But now you need to know what caused it.
- Which applications were generating traffic?
- Which devices were involved?
- Did latency increase?
- Did packet loss occur?
- Was a particular interface responsible?
- Did anything else change at the same time?
This is where synchronized monitoring views become valuable.
Lumics combines historical performance data with synchronized Top X widgets that help engineers investigate what was happening during a specific timeframe.
Rather than manually comparing different graphs and reports, engineers can narrow their investigation to the period surrounding an event and examine the related information.
The goal is to move from:
“Something spiked at 11:42.”
To:
“Here’s what was happening at 11:42, and here’s where we should investigate.”
That’s a much more useful outcome.
Put Your Polling Intervals to the Test
Here’s a simple exercise for your IT team.
Open your monitoring platform and identify the polling intervals for your most critical infrastructure.
Then ask a few questions.
- If a WAN circuit becomes saturated for forty-five seconds, will we see it?
- If CPU reaches 100% for twenty seconds, will the platform capture that?
- If a critical device fails immediately after a successful poll, how long could detection take?
- If an interface experiences intermittent packet loss, how frequently are we measuring it?
- If we investigate a problem from three months ago, will the same level of detail still be available?
And perhaps most importantly:
Do we actually know what our monitoring platform is missing?
Because the absence of an alert doesn’t necessarily mean the absence of a problem.
It may simply mean the problem occurred outside the platform’s visibility.
The Bottom Line
Five-minute polling intervals aren’t inherently bad.
But they shouldn’t be accepted without question.
Modern networks can experience meaningful performance problems in seconds.
And when those problems occur between measurements, or become diluted through averaging, engineers can lose the evidence they need to troubleshoot effectively.
Great monitoring requires more than collecting data every few minutes.
It requires appropriate polling frequency.
Accurate measurements.
Min/max visibility.
Useful historical retention.
And the ability to correlate what happened across different parts of the infrastructure.
At Lumics, we believe engineers should have the clearest possible picture of what their infrastructure actually experienced.
That’s why we emphasize accurate performance data, min/max graphing, extensive historical retention, and synchronized analysis tools that help engineers investigate anomalies rather than overlook them.
Because when something goes wrong for thirty seconds, those thirty seconds might contain the answer to your entire troubleshooting investigation.
Your monitoring platform shouldn’t make them disappear.