Virtual Environments
TL;DR
VMWare
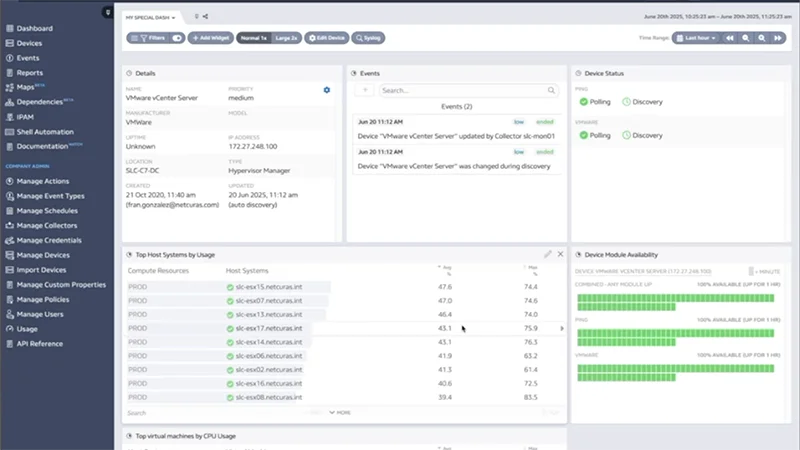
Lumics utilizes the vSphere API to gather all the data from your VCenter, analyze it, and visualize it in our wicked fast graphs and Top-X widgets.
Instantly see all the most critical data from your virtual machines in customizable dashboards with widgets sorted by the most important to least important devices or data variables.
Filter, search, and sort instantly within any widget to get to a specific device or component and quickly go back in time to see historical data.
Monitor top virtual machines or components by CPU variables, memory, disk space utilization, disk latency, and network usage.
Create customizable dashboards and reports to share various combinations of data from your virtual environments with different team members, customers, or partners.
New virtual machines can automatically be added to your monitoring when they are created within vCenter.
Lumics provides very unique visibility into your virtual machines compared to the built-in dashboards and reports provided by VMWare.
HyperV
Lumics allows you to monitor Hyper-V similarly to VMWare, with the exception of virtual device auto-detection. With Hyper-V monitoring you add each virtual machine or component you want to monitor individually.
Lumics monitors Hyper-V virtual machines and components via SNMP or WinRM.
Combine critical Hyper-V data with other data from your network in the Lumics customizable dashboards and reports, and easily set up automated alerts and actions triggered by specific events you define for your virtual environment.
More than just ping
Most ping-only licenses allow you to simply test up/down status on the device. Typically, a single packet is sent to the device periodically and the device’s status is reported on a dashboard or triggers an alert.
Lumics is unique in that it sends a flurry of packets (24 packets within a 6-second interval, repeated once per minute). This has little impact on the system from a performance standpoint, but allows us to collect other valuable data from the device beyond just up/down status.
The packet count and the frequency are configurable on a per-device basis giving you the administrative control you need to get the data you want but also keep the system running at peak performance.
"Lumics is so fast!"
"Lumics has been a game changing product."
"The data is very actionable."
"Rare among current monitoring tools."
"Engineers can be engineers and not monitoring tool administrators"
"We can monitor thousands of devices with one tool…it just works!"
"The granular data Lumics provides is a game changer!"
"It runs super quickly."
"Lumics provides all the insights we need to make quick operational decisions."
Latency and Packet Loss
Sending a flurry of packets each minute reveals critical information on ping-only devices, such as latency and packet loss, which can be stored and visualized on dashboards, used for troubleshooting purposes, trigger alerts, and can be included in reports.
Monitoring this additional data often helps prevent critical failures on ping-only devices rather than just waiting to find out one is down and then scrambling to fix it as quickly as possible.
Troubleshooting
The Lumics dashboards provide quick, intuitive views of all the critical data from your virtual machines and make it very easy to troubleshoot specific issues with a few clicks.
See which devices are potentially going to have issues at the top of each dashboard widget and take preventative action.
Quickly analyze graphs with Lumics’ unique min/max graphing algorithm (most competitors graph using averages, which often hide the most critical data points when it comes to troubleshooting).
Go back in time almost instantly to get to the root cause of specific issues, analyze trends, or compare year-over-year or seasonal trends.
Create actions and alerts from any events or data thresholds you want, and automate running scripts triggered by a specific event to instantly resolve common issues.
The Lumics Lens
Pulling all the data from your virtual environment and combining it with other network or infrastructure data can give you the single pane of glass overview of all the critical components in your system.
This has huge time-savings and troubleshooting advantages over separate individual dashboards or reports provided by the vendors. No need to connect the dots across different systems or different reports to resolve an issue – with Lumics everything is only a few clicks away.
Pricing for Virtual Environments
Lumics unique pricing model often saves our customers a lot of money compared to our competitors when monitoring virtual environments.
Lumics charges a monthly fee per physical server or host, not per virtual machine or component. The fee that Lumics charges for these physical servers is often the same or sometimes even less per month than competitors charge for each virtual machine or component, so the savings with a Lumics solution add up very quickly in larger environments.
You can request a custom price quote for your environment by completing this Quote Request form and sharing some basic information about your current device configurations.