Simple Network Management Protocol
TL;DR
Lumics dashboards and graphs are often much more insightful than the device’s built-in dashboards.
Lumics can analyze, graph, and alert on any device that sends SNMP data.
Combine SNMP data with other data from your system for a single pane of glass view.
Because devices differ on the volume and type of SNMP data they send, Lumics has various customizable dashboard and report widgets to display the data in a way that is fast and insightful.
Some devices don’t send very good data via SNMP, so Lumics accesses those via API in order to get a more robust view of performance.
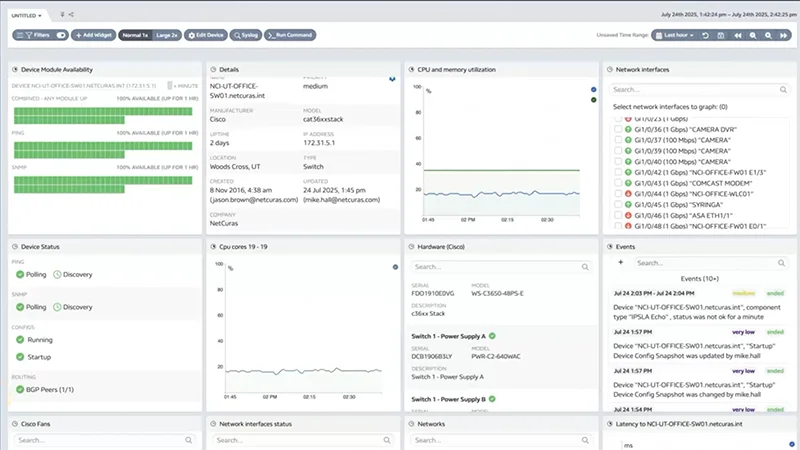
Better than Built-in Dashboards
Many devices actually offer much more robust monitoring data via their APIs or even SNMP than what they present via their internal dashboards. They often keep their internal dashboards very simple for speed or ongoing software development cost reasons.
Lumics makes every effort to get all the data we can from each device so we can analyze, graph, and help you generate actionable alerts. You are less likely to miss a critical piece of information or be unable to troubleshoot an issue when the data is brought into Lumics where it is visible and can be combined with data from other areas of your system in a “single pane of glass“.
Combine SNMP and other Data
This “single pane of glass” concept if often talked about as the holy grail within the monitoring world and Lumics has invested quite of bit of development effort to bring our customers closer to that goal.
Combine data from SNMP with syslog, NetFlow, API, WMI, Virtual environments, physical components, databases, and ping/probe into customized dashboards, reports, or alerts to see patterns developing, prevent common issues from happening, quickly troubleshoot issues when they do happen, and answer questions from peers or customers quickly and intelligently.
API data to enhance SNMP
Some devices do not provide SNMP or share very limited or less-helpful data via their SNMP, but have much more informative or robust data that is accessible via API. Meraki is one example. In these cases, Lumics pulls as much detailed information as possible via API to add to our dashboards, reports, and alerting protocols so our customers can rest assured that they’re monitoring all the components of their system with the best information possible.
"Lumics is so fast!"
"Lumics has been a game changing product."
"The data is very actionable."
"Rare among current monitoring tools."
"Engineers can be engineers and not monitoring tool administrators"
"We can monitor thousands of devices with one tool…it just works!"
"The granular data Lumics provides is a game changer!"
"It runs super quickly."
"Lumics provides all the insights we need to make quick operational decisions."