Lumics Core Technology
Lumics does a lot more than just network monitoring. Click on any topic on the left side of the page to autoscroll to that section and dig into the things you’re specifically interested in. Watch a few videos, then if you have more technical questions, schedule a technical Q&A session with us!
Topics
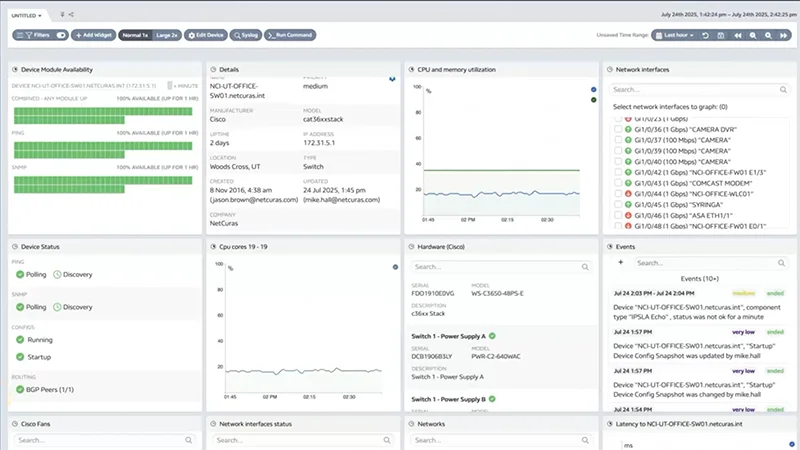
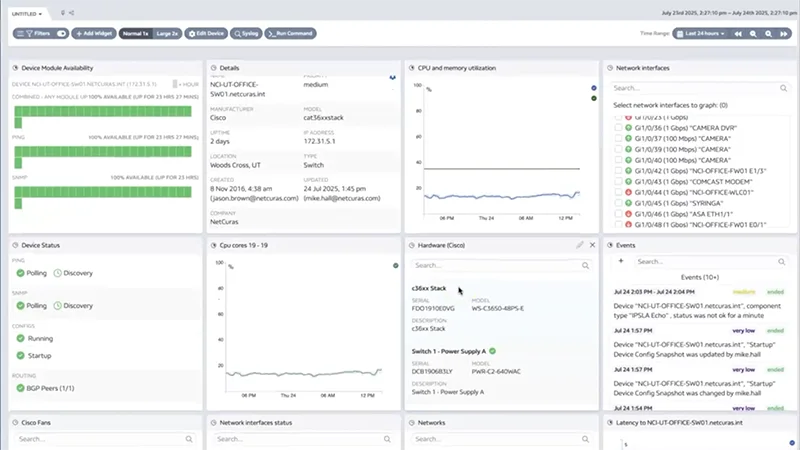
Lumics captures, organizes, analyzes, and visualizes SNMP data over time to show you what is happening with your network devices and alerting you when pre-defined criteria is met, whether it is problematic or informative.
Lumics captures, organizes, analyzes, and visualizes WMI data from Windows devices via WinRM. The Lumics Collector gathers this data locally inside your firewall, then encrypts it and sends it to the Lumics cloud via a secure SSL connection.
Lumics is unique when it comes to monitoring ping-only devices. We do more than just send a packet to check up/down status, which is why we call it Probe instead of ping. Lumics sends a flurry of packets to analyze and store latency and packet loss data which is typically overlooked by ping-only monitoring solutions, and can be very useful in troubleshooting scenarios. Lumics also can monitor jitter (for ICMP) as well as TCP port checks and HTTP ping.
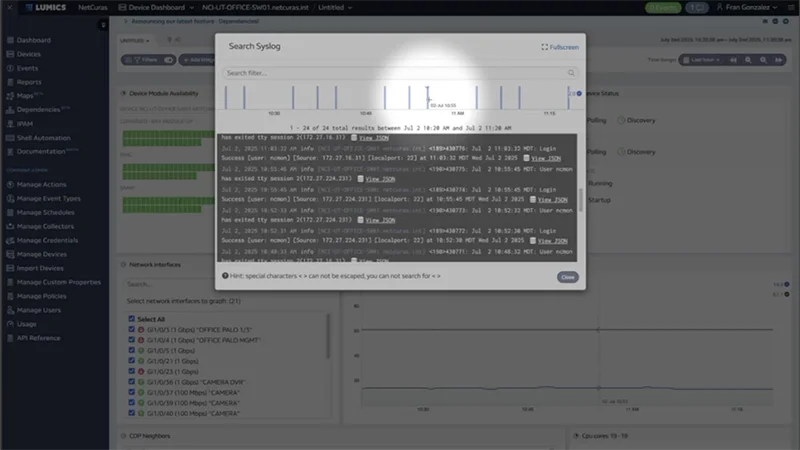
Lumics includes syslog monitoring with every Base license, up to 100K logs per day per device, pooled across all your syslog devices.
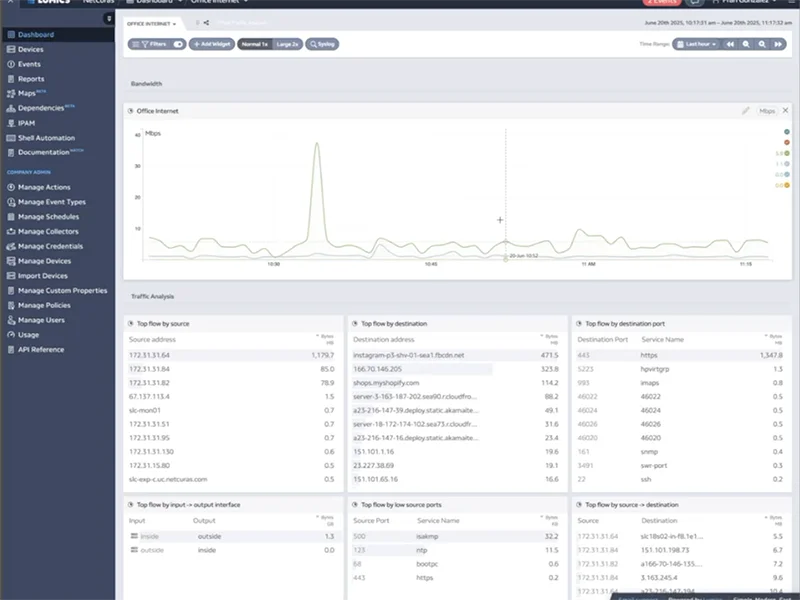
Lumics excels at NetFlow monitoring, and many of our customers list this as one of their favorite Lumics features. We store and analyze NetFlow using unique algorithms we developed that allow us to visualize this data extremely quickly, even when you’re searching far back in history. Lumics combines NetFlow with other network variables to help you troubleshoot and avoid potential problems. A Lumics NetFlow License includes up to 5 million flows per day per device, and the device totals can be pooled together across all your NetFlow devices to help you avoid overages. Lumics also supports IPFIX monitoring with the same functionality.
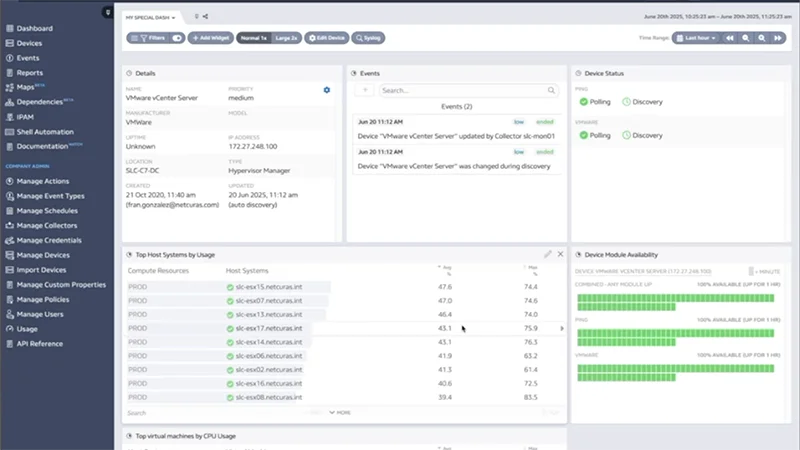
Lumics monitors and visualizes VMWare data very powerfully. The “Lumics Lens” gives you an instant view of the critical data you need to see to determine the health and performance of your virtual machines. You can look at the widgets on the dashboard and almost instantly see where the outliers are, in fine detail, so you can zero in on problems that would take a lot longer to drill down on with other platforms. Lumics’ only charges to monitor the physical servers in your virtual environment, not virtual machines or “components” like many of our competitors do.
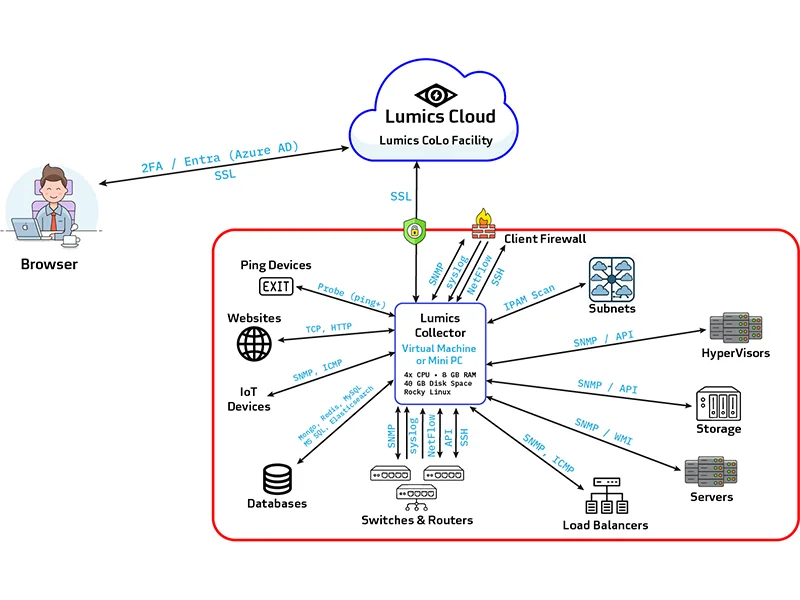
Lumics attempts to use the security protocols you’re already familiar with and using in your environment, supporting various forms of MFA as well as Entra (Azure ID). Our SaaS architecture, centered around our highly secure Collectors create a less-vulnerable point of attack than premise-based monitoring servers. Lumics is SOC 2 Type II compliant.
Server and Environmental Monitoring
Lumics monitors Windows and Linux servers, gathering and visualizing critical data about CPU, Memory, Network Bandwidth, Disk Space, PDU and Lights Out Management, iDRAC, iLO, CIMC, and other Board Management Controllers, as well as Windows Services via SNMP and WinRM protocols.
Storage Monitoring
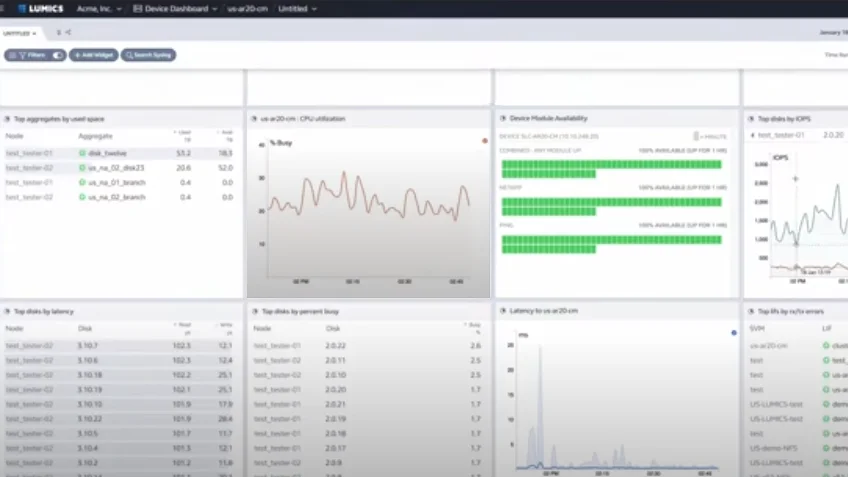
For NetApp, Cohesity, and Nimble, Lumics created advanced API integrations in order to gather and visualize more data than was available via their basic SNMP flows, giving customers greater insights into those storage platforms and associated devices. Lumics uses SNMP data from PureStorage and Nutanix platforms which mirror what you’d see in their internal dashboards but have the added advantage inside Lumics of being associated with other environmental data to help pinpoint potential problems and plan future storage needs more efficiently.
Cisco Voice Monitoring
If you use Cisco Voice infrastructure, Lumics has some powerful features related to capturing, analyzing, displaying, and alerting on various critical metrics such as Callmanager service status, SIP trunk usage, IP SLA MOS trending, phones registered, active calls, and more. Via our API integration, Lumics shows all of the same information that RTM (Real Time Monitor) shows, but via our dashboard widgets that can be combined with other data points and which have much better graphing capability.
Database Monitoring
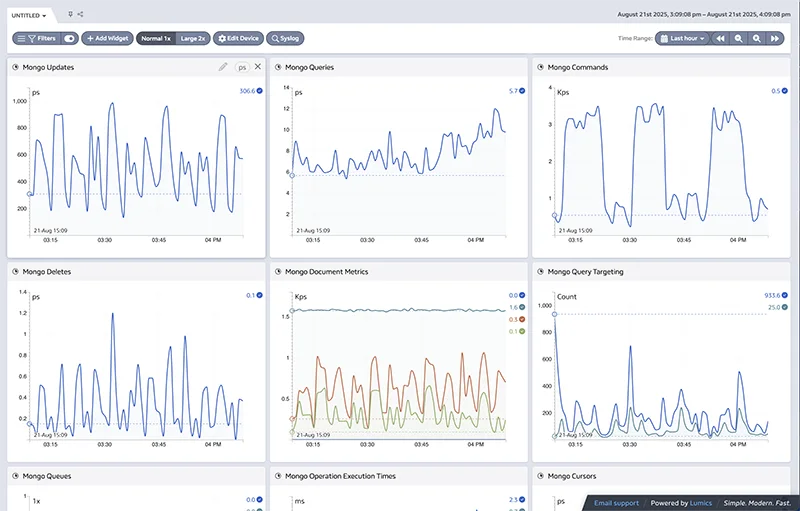
Lumics monitors important database variables across SQL, MySQL, Mongo, Elasticsearch, and Redis. SQL Monitoring includes over 400 unique data points, In Mongo, Lumics can analyze, store, and alert on Query Targeting, Execution Times, Cache Usage, Page Faults, Memory, Cache Activity, Asserts, DB storage, Network, Connection, Inserts, Updates, Queries, Commands, Queues, Deletes, Doc Metrics, Cursors, Query Executor, Scan and Order, Getmore, and Collection Sizes. For Elasticsearch Lumics analyzes Cluster/Node Health, JVM Heap Percentage, CPU Utilization, Node Latency, Garbage Collection Counts and Duration, and Circuit Breaker stats.
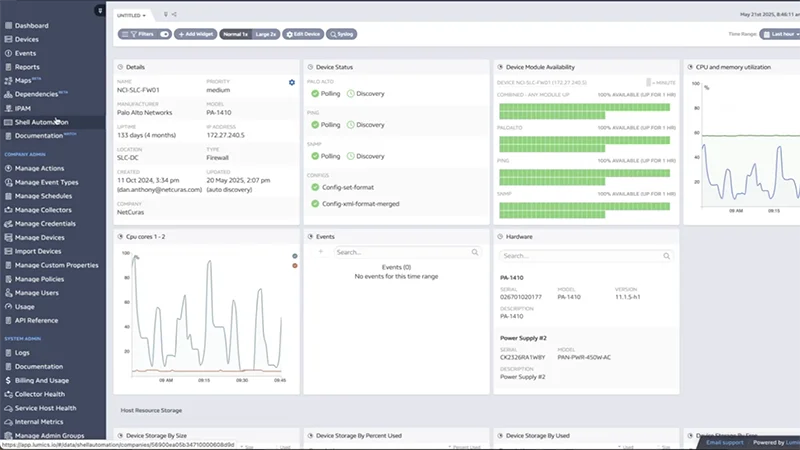
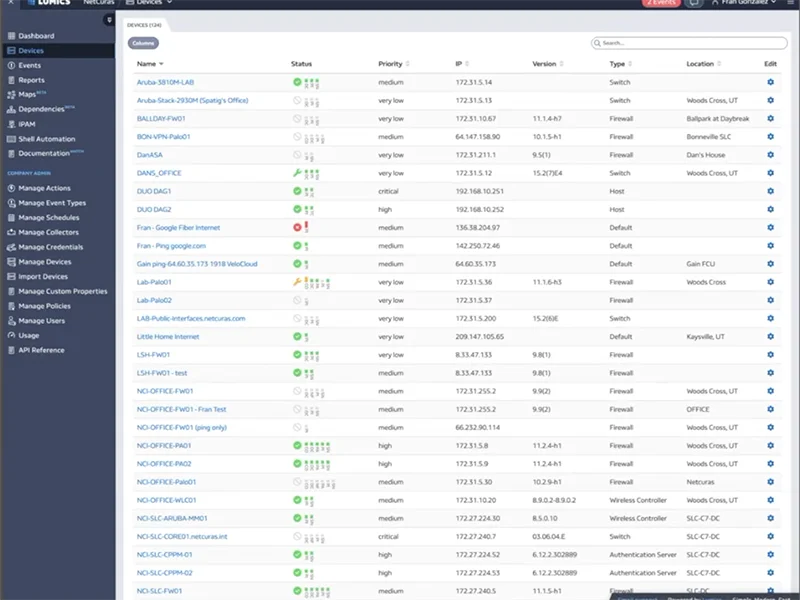
As noted above, Lumics integrates with every major hardware platform that supports SNMP or WMI, as well as many others that we can access via their APIs. The API integrations often give us more information than the basic SNMP data, which we analyze and visualize to help you identify and resolve critical network and systems issues as quickly as possible. If you have a hardware platform, database, or application monitoring requirement we currently don’t offer we are happy to add it for you!