Peace of Mind
TL;DR
Lumics has configurable alerts that can be sent via SMS, Slack, email, PagerDuty, OpsGenie, or other comms platforms.
Lumics helps you avoid alert fatigue, cut through the noise, and get right to the heart of the issue.
Lumics has incredibly fast, accurate data instead of misleading averages over time.
Lumics has customizable, shareable dashboards for different roles inside and outside your company.
Lumics has an intuitive, responsive UI that makes all types of troubleshooting only 2 or 3 clicks away.
Lumics includes IP Address Management (IPAM) at no additional cost, so you can ditch the spreadsheets!
You can add NetFlow monitoring in Lumics to any device that supports it. Lumics also supports NetFlow sampling.
Configurable Alerts
Stay on top of any problems, even if you’re not watching
Lumics allows you to set up notification alerts associated with almost any important event that happens on your network or with your network infrastructure.
Set up alerts for basic things like:
- CPU and Memory Utilization
- Disk Utilization
- Device Down
- Network Interface Bandwidth
- Network Interface % Utilization
- Critical Interface Down
or for more advanced things like:
- Routing Protocol Anomalies (BGP, OSPF, EIGRP peer/neighbor down)
- Lan-to-Lan VPN Connectivity Issues
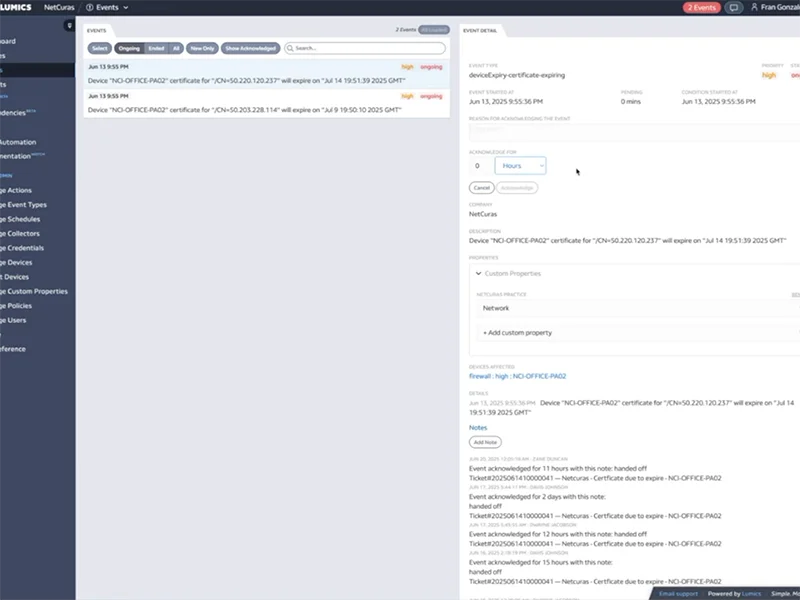
- SSL Certificate Expiration
- Detect Device Reboot
- DNS Issues
- NTP Issues
as well as hundreds of other network and systems triggers.
Lumics latency and packet loss detection is more sophisticated than most of our competitors’ solutions because we send a flurry (configurable) of ICMP packets and calculate min, max, and average latency and packet loss for each poll cycle to more accurately detect network performance issues.
Not only are alerts visible within the system in various locations, but you can receive alerts via SMS, email, Slack, Teams, PagerDuty, OpsGenie, and other communications platforms so you never miss a thing. You can integrate with and send alerts to almost any external platform using our API and webhook functionality.
In many cases Lumics “mirrors” alarms from the platforms we monitor via API so that underlying issues are visible through Lumics and you can use Lumics to send alerts to the specific team members you want, via the communications platforms they prefer. For example, when monitoring VMware, alarms are detected and Lumics creates corresponding Lumics events. This allows Lumics to send the alerts and leverage all of our alerting mechanisms and noise reduction techniques, rather than relying on a local mail server to send the alerts without any filtering or sophistication.
You can configure what types of alerts are sent to various roles so everyone on the team isn’t notified about every type of issue.
Avoid False Alarms
Eliminate noise from false alerts, non-critical alerts, or devices undergoing maintenance
In Lumics, alerts can be configured with different thresholds and dependency-awareness so you don’t get too many alerts related to non-critical issues, or alerts that are duplicates because they are all related to a device dependency upstream.
You can also set timeframes for alerts so only mission-critical alerts are sent after hours or to team members who are out of office.
Noise reduction techniques include automatic “flapping” detection along with the ability to configure alerting based on either single samples or average over longer period – for example: alert when CPU is above 90% or alert when average CPU is above 90% over a period of time such as 5 minutes.
"Lumics is so fast!"
"Lumics has been a game changing product."
"The data is very actionable."
"Rare among current monitoring tools."
"Engineers can be engineers and not monitoring tool administrators"
"We can monitor thousands of devices with one tool…it just works!"
"The granular data Lumics provides is a game changer!"
"It runs super quickly."
"Lumics provides all the insights we need to make quick operational decisions."
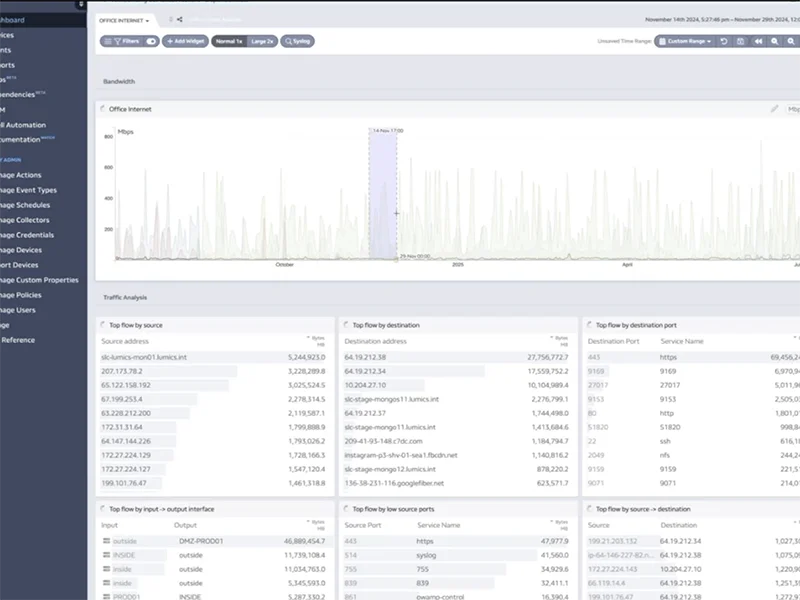
Graphs with Accurate Data
Many monitoring tools average data over time, hiding critical information
Lumics’ unique graphing algorithms not only visualize realtime data incredibly fast, they give you an accurate view of historical data by retaining all the maximum and minimum data points and not eliminating them by averaging them together (like most of our competitors’ graphing techniques). Lumics also keeps historical data as long as you are a customer, without charging extra for data storage. You can always go back and compare different time periods to plan intelligently and learn from past issues.
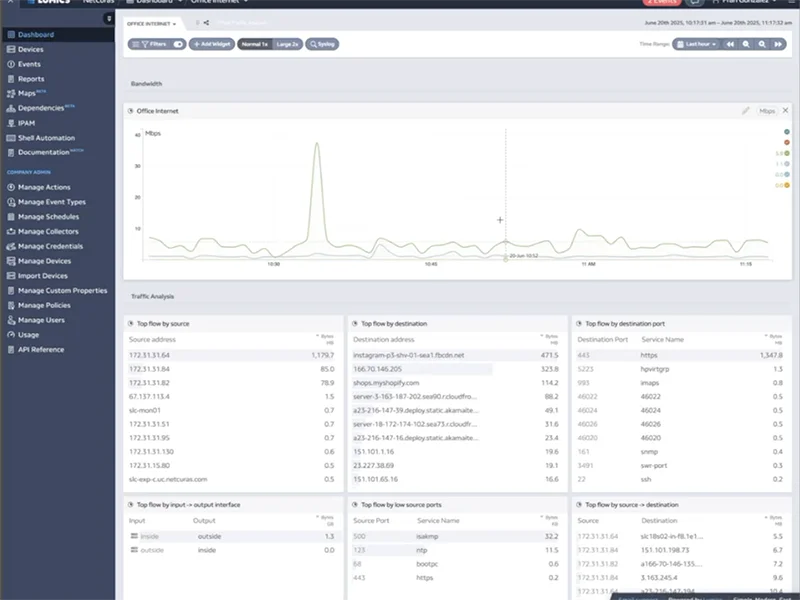
Customizable Shareable Dashboards
All the critical data in a single view customized to each role
Lumics allows you to create as many dashboards as you want. Dashboards can be personal or shared with anyone else. They can be replicated (build one and share it, then the recipient can add to it and make the new version their own). You can create executive dashboards with overall system performance, trend analysis, and forecasting data; or customer dashboards to give them a live glance at how their network is doing, if there are any critical issues, and the status of fixes; or specialist dashboards that focus on specific equipment, types of data, or geographies. Lumics provides data widgets for hundreds of data types, which can be combined together in any format to create your custom dashboards. You can drag and drop them into place and change their size depending on the type of data they present. Widgets on your dashboards also automatically sync with each other and with your timeframe controls. Change the timeframe for one widget and all the other widgets on the dashboard update automatically. This makes troubleshooting a breeze.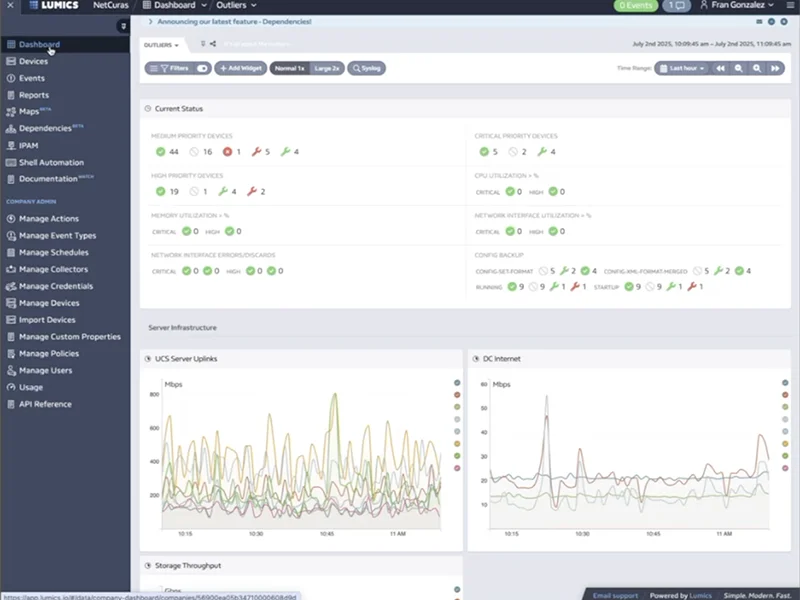
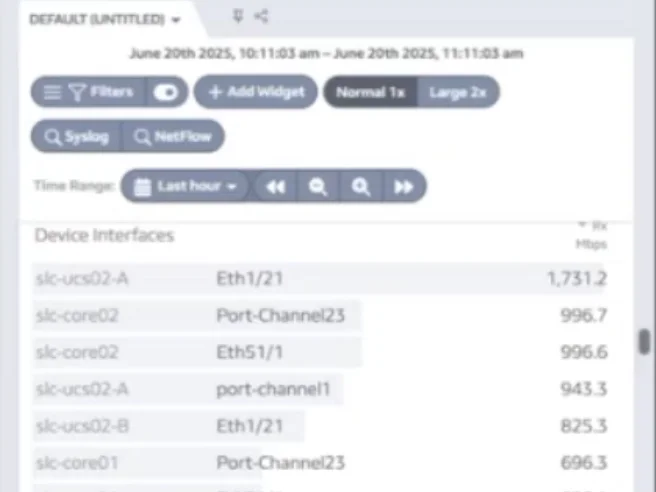
Intuitive Responsive UI
Mobile-friendly, fast, time-synced data widgets help you solve problems quickly
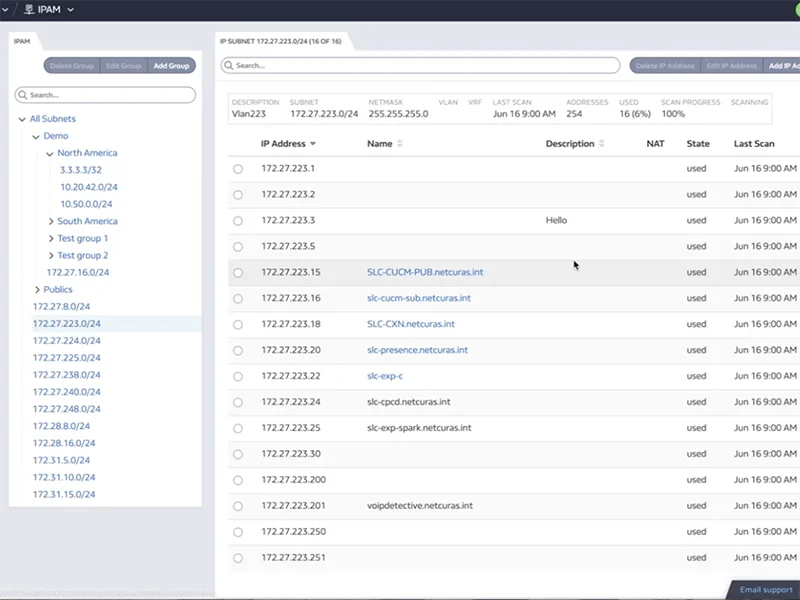
Lumics was designed for a responsive, browser-based interface and can adapt to any screen size ranging from phones to tablets to laptops and desktops, to large screen displays in your NOC. You can switch between dark mode and light mode with each dashboard and the type of data you’re viewing. You can drag and drop dashboard widgets in any order you like, and you can organize them into custom groupings. When you change the date in one data widget, all the other data widgets automatically change to that same time range, allowing you to troubleshoot specific issues very quickly. All Lumics graphs have our very helpful min/max data points in addition to the typical averaging graph line that all of our competitors provide. This unique graph view means you’ll never miss the critical anomalies that lead to bigger issues, and you won’t make bad decisions based on incomplete or misleading data.IP Address Management
Ditch the spreadsheets – Lumics offers built-in IPAM functionality
Lumics includes all the critical IP Address Management functionality you need for planning, tracking, and managing IP addresses. It features centralized IP address visibility, DHCP, static, and reserved address configurations, and allows for a fully customizable hierarchy. Migrating from other IPAM tools or spreadsheets is straightforward and easy with Lumics. You can tailor IP address scan schedules to fit your needs. If your routers and switches are monitored in Lumics, the system will automatically recognize your subnets-making it quick and easy to setup IPAM from scratch. All this core IPAM functionality is included in the Base license cost of Lumics, saving you money compared to paying for extra modules or upgrades from competitors, or paying for a completely separate IPAM tool.