Guru-Level Insights
TL;DR
Lumics is designed to help you optimize network performance – making your existing network seem faster, better, and avoid critical issues.
Lumics has shareable customizable dashboards so you can give your customers or other team members exactly the views of your network they need.
Lumics includes configurable event alerts and actions that can be sent internally and externally to anyone that needs to be in the know.
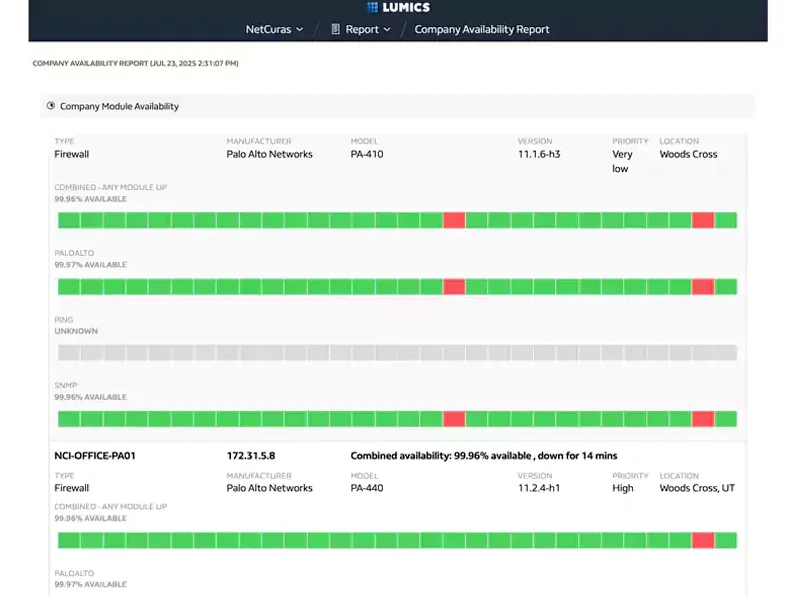
Lumics has customizable, automated reports that can be sent to executives, customers, or other teams at regular intervals, or triggered by an event.
Resolve issues within minutes instead of hours – every piece of information you need for troubleshooting is only 2-3 clicks away.
Lumics gives you almost instant access to historical data for planning, forecasting, and answering executive or customer infrastructure questions.
Lumics mapping functionality allows you to share visualizations of your network configuration with clients or other team members that need to know how things are connected and where they are located.
Lumics supports clients in banking, government, and medical sectors and is SOC 2 Type II compliant, with various forms of MFA access.
Optimize Network Performance
Make your network faster without upgrading equipment
With network and infrastructure monitoring, the devil is often in the details. At Lumics, we pay attention to the details, and help our customers stay on top of them so you don’t miss anything critical.
With other tools, data from graphs that use data averages over time (thereby eliminating the min and max data points) can be misleading and either lull you into a false sense of security, or cause you to upgrade equipment prematurely.
Alert fatigue is also common with monitoring tools that don’t give you granular controls over what triggers alerts, and to whom and how they are delivered.
Lumics lets you focus on what matters, with the most accurate data (especially historical data) to help you make informed decisions about how to improve the performance of your network and where the potential problems lie.
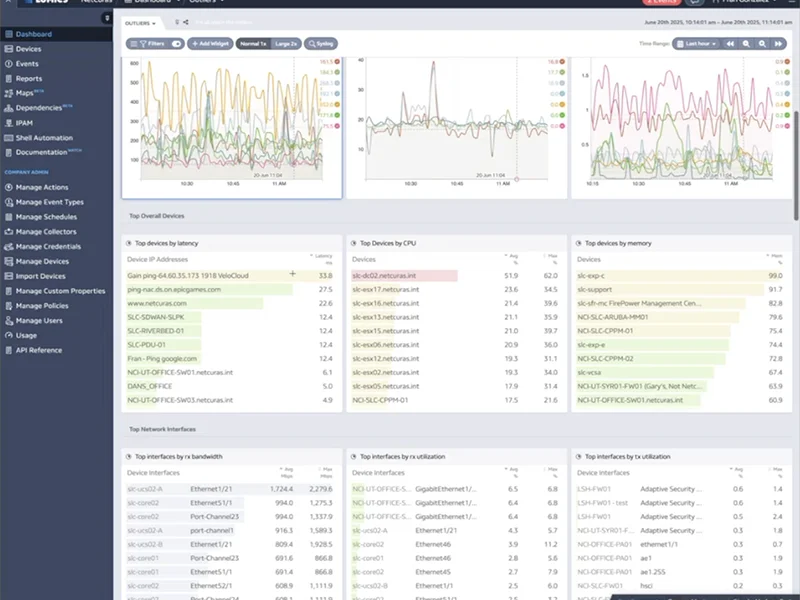
Quickly identify where the bottlenecks are, what devices are using the most bandwidth, memory, disk space, and/or CPU and what specifically is causing performance to degrade.
In Lumics, the problem areas stand out immediately and you can get to the root of the problem with a few clicks.
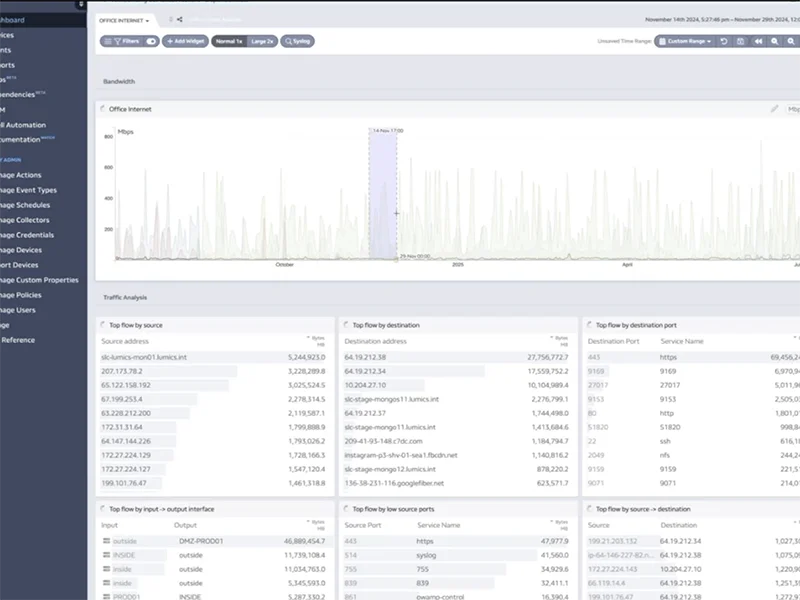
Shareable, customizable Dashboards
Everyone can see exactly what they want, or need to
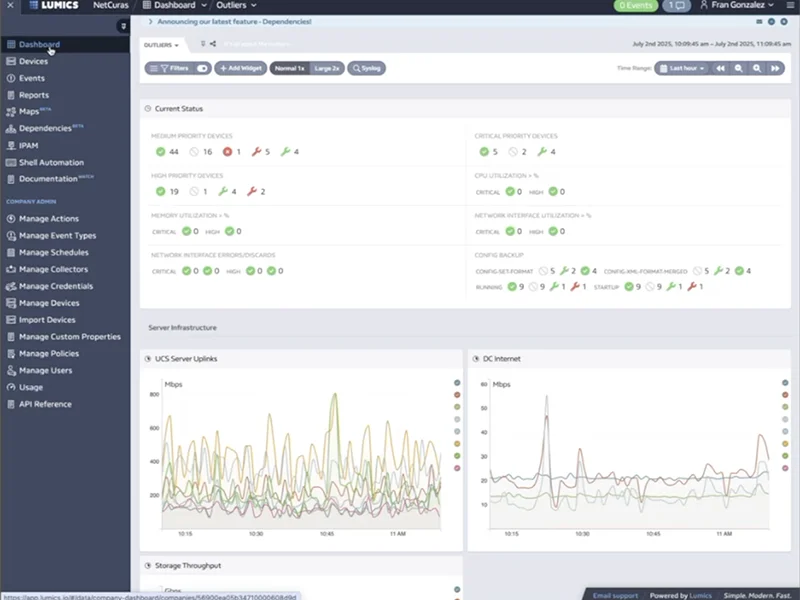
Lumics allows you to create as many dashboards as you want. Dashboards can be personal or shared with anyone else. They can be replicated (build one and share it, then the recipient can add to it and make the new version their own).
You can create executive dashboards with overall system performance, trend analysis, and forecasting data; or customer dashboards to give them a live glance at how their network is doing, if there are any critical issues, and the status of fixes; or specialist dashboards that focus on specific equipment, types of data, or geographies.
Lumics provides data widgets for hundreds of data types, which can be combined together in any format to create your custom dashboards. You can drag and drop them into place and change their size depending on the type of data they present.
Widgets on your dashboards also automatically sync with each other and with your timeframe controls. Change the timeframe for one widget and all the other widgets on the dashboard update automatically. This makes troubleshooting a breeze.
"Lumics is so fast!"
"Lumics has been a game changing product."
"The data is very actionable."
"Rare among current monitoring tools."
"Engineers can be engineers and not monitoring tool administrators"
"We can monitor thousands of devices with one tool…it just works!"
"The granular data Lumics provides is a game changer!"
"It runs super quickly."
"Lumics provides all the insights we need to make quick operational decisions."
Configurable Alerts
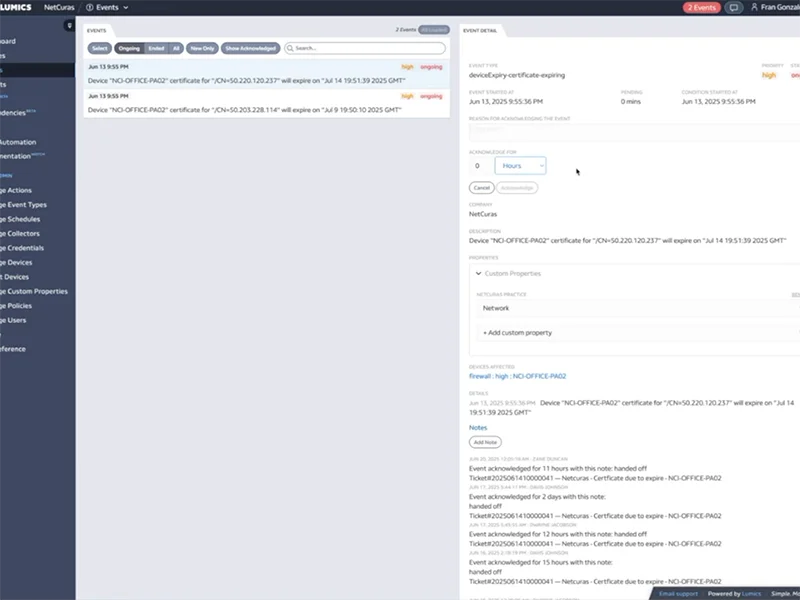
It almost always begins with an Alert
Lumics allows you to set up notification alerts associated with almost any important event that happens on your network or with your network infrastructure.
Set up alerts for basic things like:
- CPU and Memory Utilization
- Disk Utilization
- Device Down
- Network Interface Bandwidth
- Network Interface % Utilization
- Critical Interface Down
or for more advanced things like:
- Routing Protocol Anomalies (BGP, OSPF, EIGRP peer/neighbor down)
- Lan-to-Lan VPN Connectivity Issues
- SSL Certificate Expiration
- Detect Device Reboot
- DNS Issues
- NTP Issues
as well as hundreds of other network and systems triggers.
You can choose what types of alerts are sent to customers, and what types of format or communication platform they receive them in.
Not only are alerts visible within the system in various locations, but you can receive alerts via SMS, email, Slack, Teams, PagerDuty, OpsGenie, and other communications platforms using our API and webhook functionality.
In many cases Lumics “mirrors” alarms from the platforms we monitor via API so that underlying issues are visible through Lumics and you can use Lumics to send alerts to the specific people you want, who may not have direct access to those devices. For example, when monitoring VMware, alarms are detected and Lumics creates corresponding Lumics events. This allows Lumics to send the alerts and leverage all of our alerting mechanisms and noise reduction techniques, rather than relying on a local mail server to send the alerts without any filtering or sophistication.
You can configure what types of alerts are sent to various roles so everyone on the team isn’t notified about every type of issue.
Customizable Reports
Share summarized, insightful information with various people
Lumics reports, similar to our dashboards, can be customized using any combination of the data sources we ingest and analyze.
These reports can be shared on an automated schedule or triggered by a specific event, and different roles can receive the report that is customized to their needs.
Reports can be used to show hardware performance, issues, and capacity for growth; latency and packet-loss issues between physical locations; specific devices that are consistently consuming high amounts of bandwidth and why; or a list of expiring certs and when they need to be renewed.
Reports can be shared via email, SMS, or Slack as a link to live data or as a static PDF, and reports are stored for future access inside the platform.
Any widget or combination of widgets from a Lumics dashboard can be turned into a report and set up to run on an automated schedule and be sent to specific individuals inside and outside your company.
Reports can be as simple or as detailed as you want depending on their use and the desired end recipient(s).
Reports can be stored for a time period that you decide (up to 13 months) and downloaded from the client portal whenever needed.
Reports are the perfect way to keep team members and clients informed with the insights and historical data they need without having to log in to the system.
Lumics provides many basic reports but can also help you build the perfect reports for your needs, all part of our concierge-level customer service that is included in every contract.
Resolve Issues in Minutes
All critical data is 2-3 clicks away, no need to run big reports
Using a combination of Lumics’ customizable dashboards, configurable alerts, and automated reports, you have all the information you need to prevent most major network or infrastructure issues from happening in the first place.
However, when something unexpected does occur, with Lumics you are never more than 2 or 3 clicks away from the information you need to identify the root cause of the issue and what needs to be done to fix it.
Problems can be resolved quickly, usually before customers or other team members realize something happened. Lumics can help you and your team provide the confidence and peace of mind for your customers or the rest of your company that the network is performing optimally.
With Lumics, most data is near real-time and historical data can be accessed very quickly. No need to initiate a lengthy report then go to lunch while you wait for the data to be gathered and summarized.
Quick access to Historical Data
Lumics can access historical data wicked fast
One of the most powerful aspects of the Lumics monitoring platform is the core architecture. The unique way we consume, aggregate, and analyze the data we ingest from all your devices makes it possible for us to create wicked fast, extremely accurate graphs even with historical data going back many years.
Because of this unique data architecture, Lumics is able to efficiently store and retrieve historical data in a way most of our competitors can’t. It also positions us nicely to add new device and 3rd-party API data in the future, as well as take advantage of A.I. training models and automated processes that will help you prevent and resolve issues even more quickly than ever before.
This unique architecture also allows us to offer historical data storage as part of our core license costs and not charge our customers extra to keep data around as long as you need. This is also different than the way most of our competitors charge.
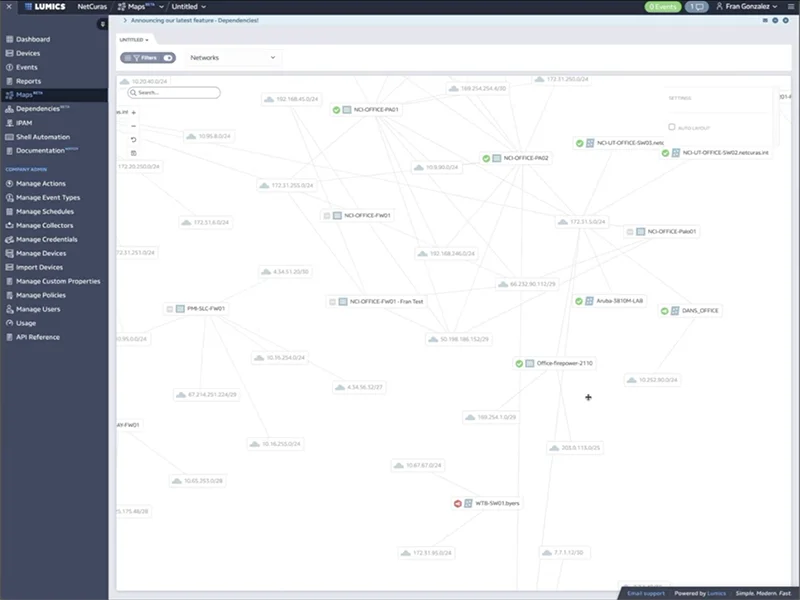
See How It's All Connected
Lumics mapping gives you a visual representation of what’s connected, how, and where
Lumics includes three different ways you can visualize how devices are connected together: Geographical, Logical, and Dependency.
The Geographic map shows where devices are located on a world map that can be zoomed in, easily navigated, printed and shared. The Geographic map shows how devices are connected to each other, and their current up/down status in a single glance. You can click on a device and dig deeper into its specific performance data.
The Logical map shows how devices are organized by subnet. You can quickly filter the view with letters in the name, or numbers in the IP address, then follow the connections to see how devices are communicating with each other.
The Dependency map shows which devices are dependent on each other, in an expandable, hierarchical view. Quickly see which downstream devices are effected by upstream devices. Reduce the noise related to duplicate alerts by suppressing alerts on downstream devices that are being caused by an upstream device that is already generating alerts.
Secure
Lumics is SOC 2 Type II compliant and extremely secure
Lumics has many customers in banking, medical, legal, and government sectors where data security is mission critical.
Lumics has invested in being SOC 2 Type II compliant, and continues to take security very seriously in all of our product development and testing processes.
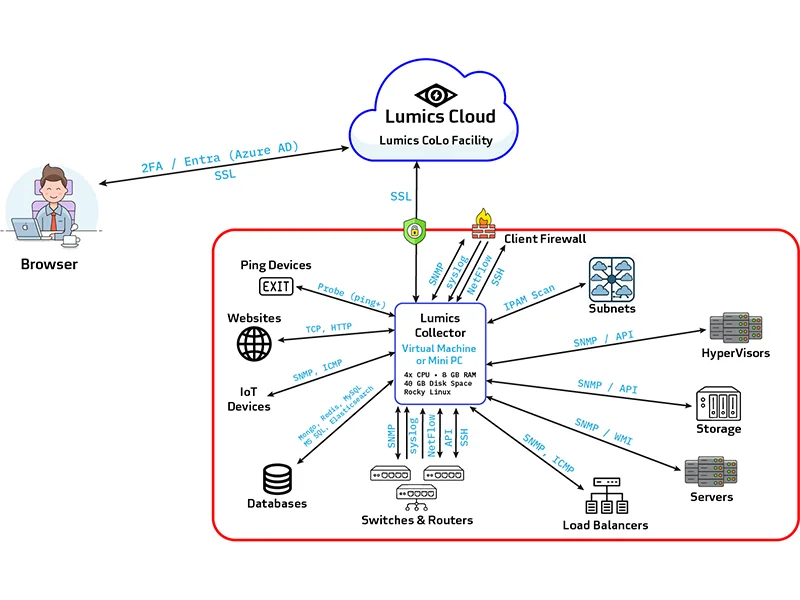
Lumics supports multiple MFA protocols, including SMS, email, and Authenticator app verifications at log in. Lumics also supports Entra ID (fka Azure AD).
Lumics’ SaaS Collectors are designed to be an unlikely point of vulnerability, compared to premise-based monitoring solutions because the Collectors run on lightweight virtual machines or mini-PCs that don’t have many of the traditional security holes or entry points that hackers or viruses take advantage of.