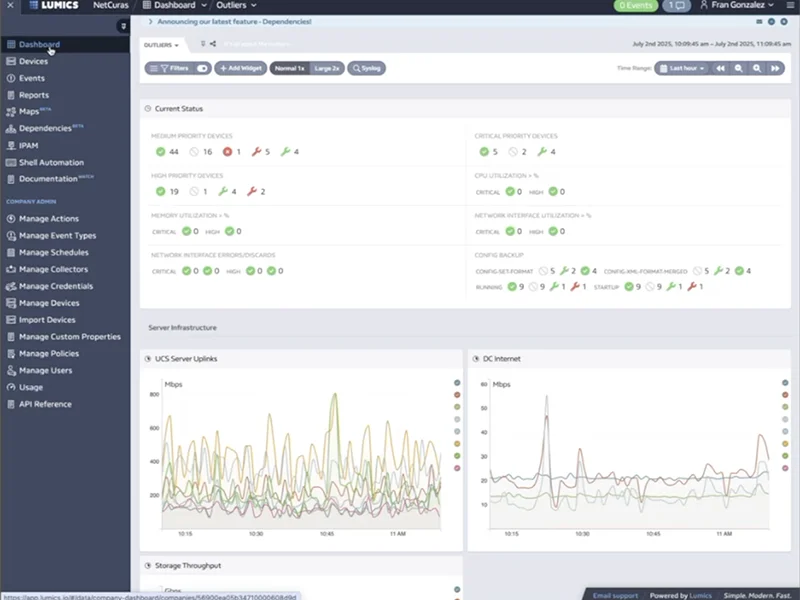
Customizable Dashboards
TL;DR
Lumics has highly customizable dashboards that show you exactly what you want to see for different use cases.
You can have as many dashboards as you need, and give different people access to the dashboards that are specific to their interests.
Lumics has hundreds of widgets to choose from, that you can combine any way you want, save as a named Dashboard, and give access to different people.
The Lumics dashboard has intuitive timeframe controls that let you go back in time quickly.
Dashboard widgets sync in time with each other when you deep dive inside of one.
Lumics dashboards are useful both for ongoing monitoring and notifications, as well as digging into the specifics when troubleshooting or doing historical analysis and forecasting.
Highly Customizable
Lumics allows you to create as many dashboards as you want. Dashboards can be personal or shared with anyone else. They can be replicated (build one and share it, then the recipient can add to it and make the new version their own).
Widgets on the dashboard can be placed wherever you want, and can be organized into different sections with visual dividers. Widgets can be resized to most optimally show different types of data over specific timeframes.
Dashboards can be viewed in Dark Mode, Light Mode, or be synced to change with your OS color mode.
All the Views for all the Roles
You can create executive dashboards with overall system performance, trend analysis, and forecasting data; or customer dashboards to give them a live glance at how their network is doing, if there are any critical issues, and the status of fixes; or specialist dashboards that focus on specific equipment, types of data, or geographies.
Create as many types of dashboards as you want, for your personal use or to share with others.
"Lumics is simple, lightweight, and fast."
"Lumics is so fast!"
"Lumics has been a game changing product."
"The data is very actionable."
"Rare among current monitoring tools."
"Engineers can be engineers and not monitoring tool administrators"
"We can monitor thousands of devices with one tool…it just works!"
"The granular data Lumics provides is a game changer!"
"It runs super quickly."
"Lumics provides all the insights we need to make quick operational decisions."
So many Widgets
Lumics provides data widgets for hundreds of data types, which can be combined together in any format to create your custom dashboards. You can drag and drop them into place and change their size depending on the type of data they present.
By default, widgets list all the top devices or data points in descending order. Unlike other dashboards, Lumics doesn’t just show the Top 10 or Top 20 (requiring you to go down a rabbit hole to see more data), but lists ALL the devices or data points in a single view allowing you to quickly scroll or page through them.
Lumics widgets also have a real-time search / filter bar that lets you quickly see only the devices or data points that match specific criteria. Drill down to the exact items you’re looking for within seconds, for rapid troubleshooting or research.
Time Controls
Widgets on your dashboards also automatically sync with each other and with your timeframe controls. Change the timeframe for one widget and all the other widgets on the dashboard update automatically. This makes troubleshooting a breeze.
You can zoom in on a very specific spike or dip on a graph by dragging over the area of interest, and the graph automatically zooms the visible area to show you just what you selected. Simultaneously, all the other widgets on the dashboard reset to the same timeframe so you can see all the corresponding data for the spike or the dip you’re investigating.
You can also jump to a specific day or time via a drop-down control, and you can fast forward or rewind hours, days, weeks, or months at a time with forward and backward arrows.
Instant Troubleshooting
Almost every data point in Lumics has an associated graph that can be instantly viewed with a single click. Lumics graphs allow you to quickly scroll backwards and forwards in time and you can drag across any part of a graph to zoom into that specific timeframe. All the other widgets on the dashboard will adjust their timeframes to stay in sync with the one you’re zooming into.
The powerful min/max graphing in Lumics also lets you see the anomalies in performance or device behavior for the specific data point you’re viewing, instead of just the averages like most of our competitors’ graphing solutions show. This is extremely useful in troubleshooting scenarios and insures you never miss a critical piece of data.
All data points on the dashboard widgets are sorted such that the most important / relevant / critical data points are at the top of each list, visible together with a single glance.
Data points within each widget have real-time filtering so you can quickly get to the specific information you need to see.
As mentioned above, all the widgets on a dashboard are time-synced together so when you zoom into one data point and a specific timeframe, all the other widgets adjust their timeframe views instantly so you can quickly see what was happening with related data points or devices and understand the root cause of the issue you’re troubleshooting.
Historical Analysis
Lumics stores historical data for almost all device types and data points much longer than most of our competitors, and we don’t charge extra for data storage.
We want our customers to have instant access to as much information as you need to make informed decisions about evolving patterns, resource and infrastructure planning, seasonal issues, and hardware reliability and comparisons over time.
Our SaaS architecture also makes it possible to continue to capture and store monitoring data on the local Collector in the event that there is a connectivity issue between your location(s) and the Lumics Cloud. Then, when the connection is restored the local Collector will sync up with the Cloud and none of your data is lost.
Lumics also has data redundancy and failover so you will always have access to your information.