By Lumics | September 11, 2026 | 7 min read
Key Takeaways
- Keeping historical monitoring data only matters if engineers can quickly access and investigate it when problems occur.
- Aggressive data averaging can erase the short-lived spikes and anomalies that provide the most important troubleshooting clues.
- Longer data retention allows IT teams to investigate intermittent problems, identify trends, and compare current behavior with meaningful history.
- Synchronized graphs and Top X views help engineers correlate specific events with the devices, applications, interfaces, and resources involved.
- Great historical monitoring doesn’t just show what happened; it helps engineers understand why it happened.
A user reports that an application was slow yesterday afternoon.
Everything looks fine now.
So you open your monitoring platform and go back to the time of the reported problem.
There’s the historical graph.
Unfortunately, it doesn’t show anything out of the ordinary.
Maybe the data has already been averaged.
Maybe the monitoring interval missed the event entirely.
Maybe the graph shows a spike, but there’s no easy way to determine what caused it.
Or perhaps the platform simply doesn’t retain the detailed data long enough to investigate.
Technically, you have historical monitoring.
Practically, it isn’t helping you answer the question. And that’s the problem.
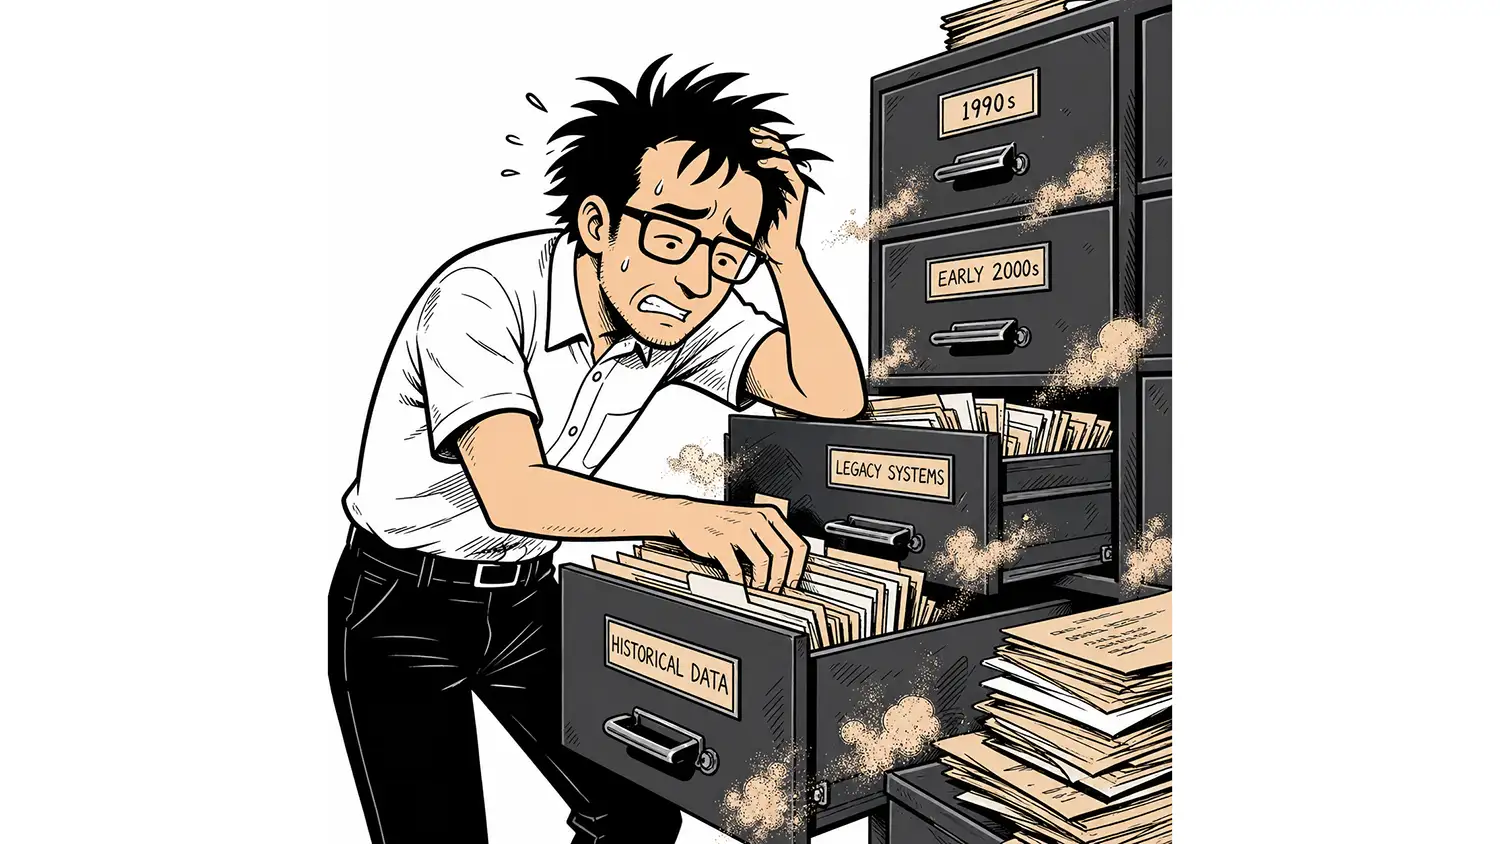
Historical data isn’t valuable because you stored it. It’s valuable because of what you can learn from it.
Retention Is Only the Beginning
Monitoring vendors love talking about data retention.
30 days. 90 days. One year. Two years.
Those numbers matter.
But retention alone doesn’t tell you whether the data will actually be useful.
There are really three questions organizations should ask:
- How long do you keep the data?
- How much detail do you preserve?
- How easily can I explore it?
If any one of those is missing, the value of your historical monitoring drops dramatically.
Yesterday’s Problem Is Today’s Mystery
Some of the hardest IT problems are the ones you can’t reproduce.
- “The network was slow yesterday.”
- “Our application froze for a few minutes Tuesday morning.”
- “Every afternoon around 2:00, something happens.”
- “The connection dropped last week, but then it came back.”
By the time the ticket reaches an engineer, everything may be operating normally.
That’s exactly when historical monitoring becomes most valuable.
Engineers need to travel back to the moment the problem occurred and see what the infrastructure was doing.
CPU.
Memory.
Latency.
Packet loss.
Interface utilization.
Application traffic.
Device health.
If the evidence still exists, troubleshooting can continue. If it doesn’t, engineers are left guessing.
Historical Data Shouldn’t Get Less Accurate With Age
There’s a common compromise in monitoring platforms.
As data gets older, it gets averaged.
A platform might retain highly granular information for a short period and then consolidate those measurements into increasingly larger averages.
That reduces storage requirements.
It also changes the story.
Imagine an interface that operates around 20% utilization most of the time but briefly reaches 100%.
That spike might explain exactly why users experienced an outage.
Average it together with the surrounding measurements, and suddenly the graph shows 35%.
The problem disappears.
Nothing about the actual event changed. Only the historical record did.
That’s why Lumics uses min/max graphing to preserve the important extremes within monitoring data.
Averages still help show overall trends, but minimum and maximum values preserve the peaks and valleys that tell engineers something unusual actually happened.
Because historical monitoring shouldn’t gradually erase history.
Longer Retention Creates More Context
There are also problems you can’t understand by looking at a few days of data.
Is this bandwidth spike unusual?
Maybe.
But what if it happens every Monday?
Is CPU utilization gradually increasing?
Is storage performance deteriorating over several months?
Does application latency increase at the end of every quarter?
Is a WAN circuit consistently approaching capacity during certain business cycles?
Longer retention changes the questions engineers can answer.
Instead of simply asking:
“What happened yesterday?”
They can ask:
“Has this happened before?”
That distinction is incredibly valuable.
Lumics preserves monitoring data longer than many traditional monitoring platforms because infrastructure history becomes more useful as patterns emerge over time.
Capacity planning, baselining, recurring incident analysis, and long-term troubleshooting all depend on having enough history to establish meaningful context.
Finding the Spike Isn’t Enough
Suppose historical monitoring works perfectly.
You go back to 2:17 PM yesterday and immediately see a huge spike in network utilization.
Great. Now what?
Which device caused it? Which interface? Which application?
What else was happening at exactly that moment?
This is where the historical data in many monitoring tools stops being helpful.
They show you that something happened.
Then they leave you to figure out why.
That usually means opening more graphs, changing time ranges, running reports, switching dashboards, and manually comparing timestamps.
The evidence exists. The engineer still has to assemble it.
Time Should Connect the Data
Time is one of the most powerful correlation tools available during troubleshooting.
If five things changed at exactly the same moment, there’s a good chance they’re related.
That’s why historical graphs become much more powerful when different monitoring views stay synchronized.
In Lumics, engineers can select or zoom into a specific timeframe and have related Top X widgets update to reflect that same period. That changes the investigation.
Instead of simply seeing that bandwidth spiked at 2:17 PM, you can explore what was happening during that spike.
Which interfaces were busiest?
Which applications were consuming bandwidth?
Which devices were experiencing the highest utilization?
Which resources changed the most?
Now you’re not just looking at a graph.
You’re investigating an event.
Top X Turns History Into an Investigation
Top X views are particularly useful because they answer a question engineers ask constantly:
What contributed the most?
- Top interfaces.
- Top applications.
- Top devices.
- Top utilization.
- Top response times.
- Top consumers.
The real power comes when those rankings are connected to the timeframe you’re investigating.
A Top X list for the entire day may tell you one thing.
The same list for the five minutes surrounding an incident may tell you something completely different. That’s an important distinction.
When an engineer narrows a graph to the exact moment something happened, Lumics can synchronize the related Top X widgets with that timeframe.
The data begins explaining itself.
Correlation Beats Comparison
Traditional troubleshooting often requires engineers to compare information manually.
Open Graph A.
Remember the timestamp.
Open Graph B.
Adjust the timeframe.
Open another report.
Compare the values.
Go back to Graph A.
That’s not correlation.
That’s detective work.
A better monitoring experience connects those views automatically.
When the timeframe changes, the supporting information changes with it.
Engineers can move through an incident and watch the surrounding data respond.
Instead of repeatedly asking: “What was happening here at 2:17?”, the platform starts answering the question.
Historical Data Is Also a Capacity Planning Tool
Not every investigation begins with an outage. Sometimes the question is whether you’re about to have one.
Long-term historical data helps organizations identify infrastructure that is gradually approaching its limits.
- WAN utilization creeping upward.
- Storage capacity steadily declining.
- Database response times increasing.
- CPU peaks becoming more frequent.
- Network traffic growing month over month.
Short retention windows make these trends difficult to identify.
Longer, accurate historical data allows engineers to distinguish a temporary spike from a developing pattern.
That makes monitoring useful not only for troubleshooting yesterday’s problem, but for preventing tomorrow’s.
Your Monitoring Platform Should Have a Memory
Modern infrastructure changes constantly.
Engineers can’t remember every spike, alert, configuration change, performance anomaly, or unusual traffic pattern.
Your monitoring platform should.
That memory should be better than simply storing rows in a database.
It should preserve enough detail to reconstruct what actually happened.
It should retain enough history to recognize recurring patterns.
It should make that history easy to explore when someone needs an answer.
That’s the difference between data storage and operational memory.
Put Your Historical Monitoring Data to the Test
The next time someone reports an old problem, see how quickly your monitoring platform can answer these questions:
- Can I immediately navigate to the exact timeframe?
- Can I still see short-lived spikes?
- Has the data been averaged since the event occurred?
- Can I zoom into the anomaly without losing detail?
- Can I see which devices or interfaces were most active during that exact period?
- Can I correlate related performance metrics without manually matching timestamps?
- Can I compare the event with similar periods weeks or months earlier?
If answering those questions requires exporting data, building reports, opening multiple applications, or discovering that the detail no longer exists, your platform may be retaining historical data without making it truly useful.
The Bottom Line
Historical monitoring shouldn’t be an archive.
It should be an investigation tool.
Long retention gives engineers the history.
Min/max graphing preserves the anomalies.
Synchronized Top X widgets provide the context.
Together, they allow engineers to move backward through time and investigate infrastructure almost as if the event were happening right now.
At Lumics, we believe historical data should remain accurate, accessible, and useful long after it was collected.
That’s why Lumics preserves monitoring data for extended periods, retains the important peaks and valleys through min/max graphing, and allows engineers to explore specific timeframes with synchronized Top X views that reveal what was happening at that exact moment.
Storing yesterday’s data isn’t the goal.
The goal is being able to use yesterday’s data to answer today’s questions.