Key Takeaways
- Alert fatigue is caused more by low-quality alerts than by the number of alerts.
- Alerts that provide context help engineers identify and resolve problems much faster.
- Static thresholds often create unnecessary noise because modern networks are constantly changing.
- Great monitoring reduces cognitive load by making troubleshooting faster and simpler.
- Accurate, actionable alerts build trust and help IT teams respond with confidence.
Monitoring systems are supposed to help engineers respond faster. Instead, many end up creating so much noise that teams gradually stop trusting the alerts altogether.
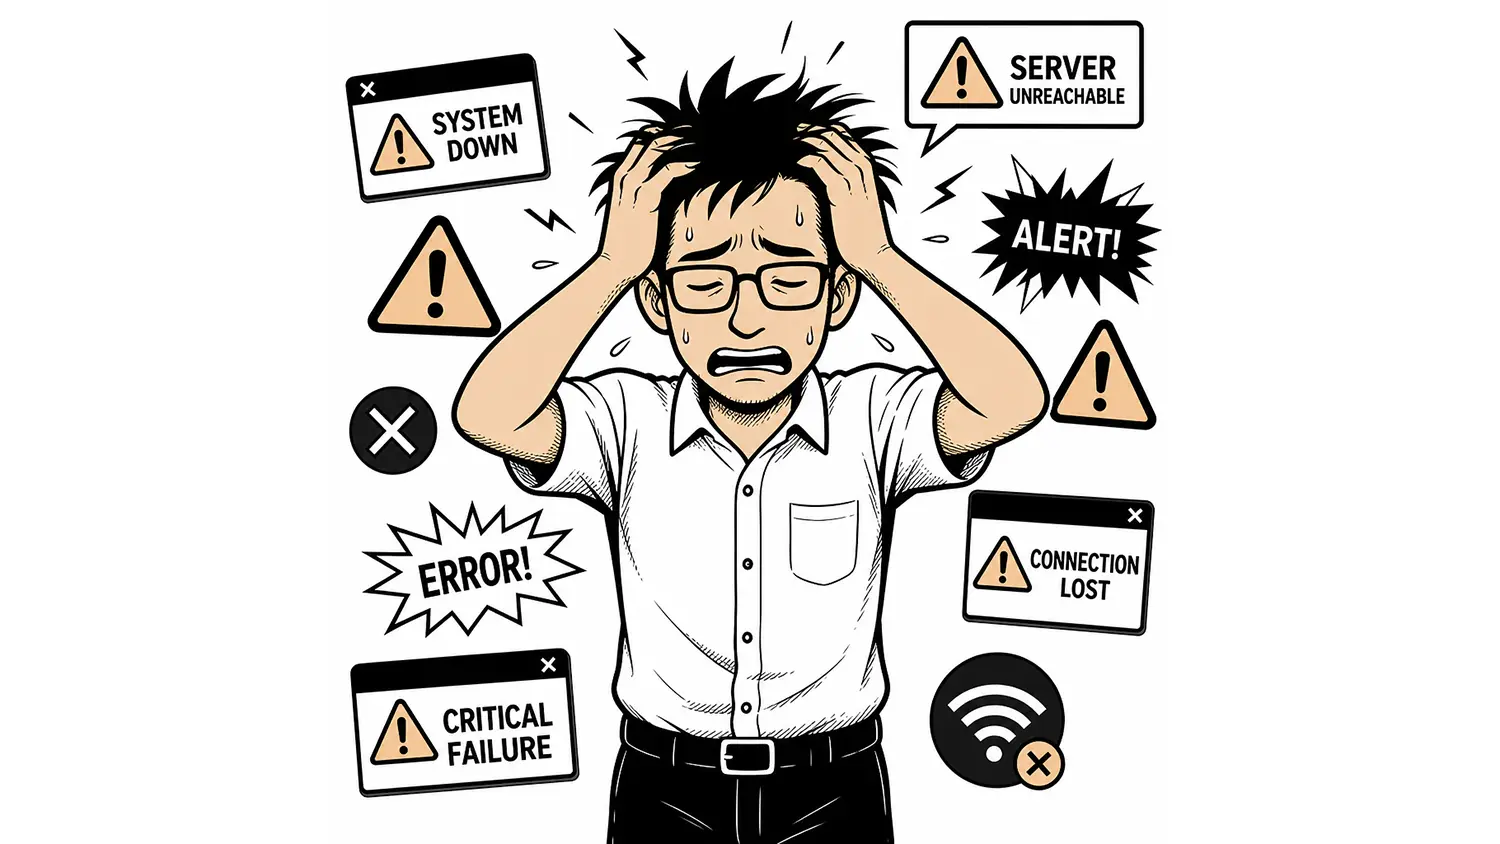
In this article, we’ll explore why alert fatigue isn’t really caused by having too many alerts. It’s caused by too many alerts that lack context or aren’t actionable. We’ll also look at how better monitoring helps engineers focus on real issues, troubleshoot faster, and regain confidence that when an alert arrives, it actually matters.
Every IT professional has lived this moment.
Your phone buzzes at 2:14 AM.
A monitoring alert.
You open your laptop expecting disaster.
Five minutes later, you discover it was a CPU spike that lasted all of 18 seconds.
Nothing actually failed.
No users noticed.
You go back to bed.
The next morning, another alert.
Then another.
Then twenty more.
Eventually, something changes. Not in your monitoring platform, but in your brain.
You stop trusting the alerts.
And that’s when monitoring stops protecting your business.
The Real Cost of Alert Fatigue
People often think alert fatigue is caused by having too many alerts.
That’s only partially true.
The real problem is too many low-confidence alerts.
Every false alarm chips away at an engineer’s confidence until every notification becomes background noise.
Eventually, teams begin asking questions like:
“Is this another false positive?”
“Can this wait until tomorrow?”
“Didn’t we see this yesterday?”
“I’ll check it after this meeting.”
Those few minutes of hesitation are often the difference between a small incident and a major outage.
Ironically, organizations spend thousands, or even hundreds of thousands of dollars on monitoring software only to train their engineers to ignore it.
More Monitoring Doesn’t Automatically Mean Better Monitoring
Many monitoring platforms take a “monitor everything” approach.
Collect every metric.
Alert on every threshold.
Store every event.
On paper, it sounds comprehensive.
In practice, it often creates an avalanche of data that engineers must sort through before they can answer a simple question:
Is something actually wrong?
The goal of monitoring isn’t to collect the most data.
The goal is to help someone make the correct decision as quickly as possible.
Those are two very different objectives.
Context Matters More Than Volume
Imagine receiving these two alerts.
Alert #1
CPU utilization exceeded 90%.
Useful?
Maybe.
Now compare it to this.
Alert #2
CPU utilization exceeded 90%.
At the same time:
• Interface utilization doubled
• Memory remained normal
• Packet loss increased
• Response times tripled
• NetFlow shows a single application consuming 72% of bandwidth
The second alert tells a story.
The first one creates work.
Experienced engineers don’t troubleshoot isolated metrics.
They investigate relationships.
The faster your monitoring platform reveals those relationships, the faster problems get resolved.
The Three Questions Every Alert Should Answer
A useful alert should immediately answer three questions.
1. What changed?
Not just that a threshold was crossed.
What actually changed?
Did traffic spike?
Did an interface flap?
Did latency increase?
Did a service restart?
Without change detection, engineers spend the first several minutes simply trying to understand what they’re looking at.
2. What else changed at the same time?
Infrastructure problems rarely happen in isolation.
One issue often triggers several others.
If your monitoring platform forces engineers to jump between dashboards just to correlate events, you’ve increased troubleshooting time before anyone has even started fixing the problem.
Good monitoring connects the dots automatically.
3. Does this actually impact the business?
Not every technical issue deserves a 2:00 AM phone call.
A failed lab switch isn’t the same as a failed production firewall.
An overloaded test server isn’t the same as a saturated WAN connection serving hundreds of users.
Alert severity should reflect business impact, not just technical thresholds.
Why Static Thresholds Age Poorly
Many monitoring systems still rely on static rules.
CPU above 90%.
Memory above 80%.
Interface utilization above 95%.
The problem is that networks don’t operate on static schedules anymore.
Traffic patterns change throughout the day.
Cloud workloads scale automatically.
Backups, patching windows, software deployments, and large file transfers all create perfectly normal spikes.
Static thresholds often generate alerts precisely when nothing unusual is happening.
The result is predictable.
Engineers become conditioned to ignore alerts because most of them aren’t actionable.
Accuracy Builds Trust
The best monitoring platforms don’t just detect problems.
They build confidence.
Every alert should make an engineer think:
“If this system is telling me something is wrong, I’d better look.”
That level of trust isn’t created by sending more notifications.
It’s earned through accuracy.
Accurate monitoring means:
- High-quality data collection
- Fast polling intervals
- Intelligent correlation
- Historical context
- Clear visualizations
- Actionable alerts
When engineers trust the data, they act faster.
Monitoring Should Reduce Cognitive Load
One of the least discussed costs in IT is mental overhead.
Every dashboard.
Every tab.
Every report.
Every disconnected graph.
Every additional click forces engineers to rebuild the story in their heads.
That’s exhausting.
Monitoring software should remove cognitive load, not create more of it.
The best tools help engineers answer questions in seconds instead of forcing them to become detectives.
What Great Monitoring Feels Like
The best monitoring systems have something in common.
They feel almost boring.
Not because nothing happens.
Because when something does happen, engineers already know where to look.
They aren’t hunting through twenty dashboards.
They aren’t exporting CSV files.
They aren’t waiting five minutes for reports to generate.
The answer is already there.
That’s when monitoring changes from being a reporting tool into a decision-making tool.
The Bottom Line
Every alert competes for an engineer’s attention.
Attention is finite.
If your monitoring platform wastes it on noise, eventually the important alerts get ignored along with everything else.
Reducing alert fatigue isn’t about sending fewer alerts.
It’s about sending better ones.
When monitoring provides accurate data, meaningful context, and clear relationships between events, engineers spend less time investigating and more time solving problems.
That’s exactly what monitoring should do.
At Lumics, we believe monitoring should help engineers answer two questions as quickly as possible:
- What’s happening on my network right now?
- How is it impacting my business?
When your monitoring platform consistently answers those questions with speed and clarity, your team starts trusting the alerts again. And when engineers trust the alerts, they respond faster, resolve issues sooner, and spend more time improving their infrastructure instead of chasing false alarms.